Martinsville Visualizations
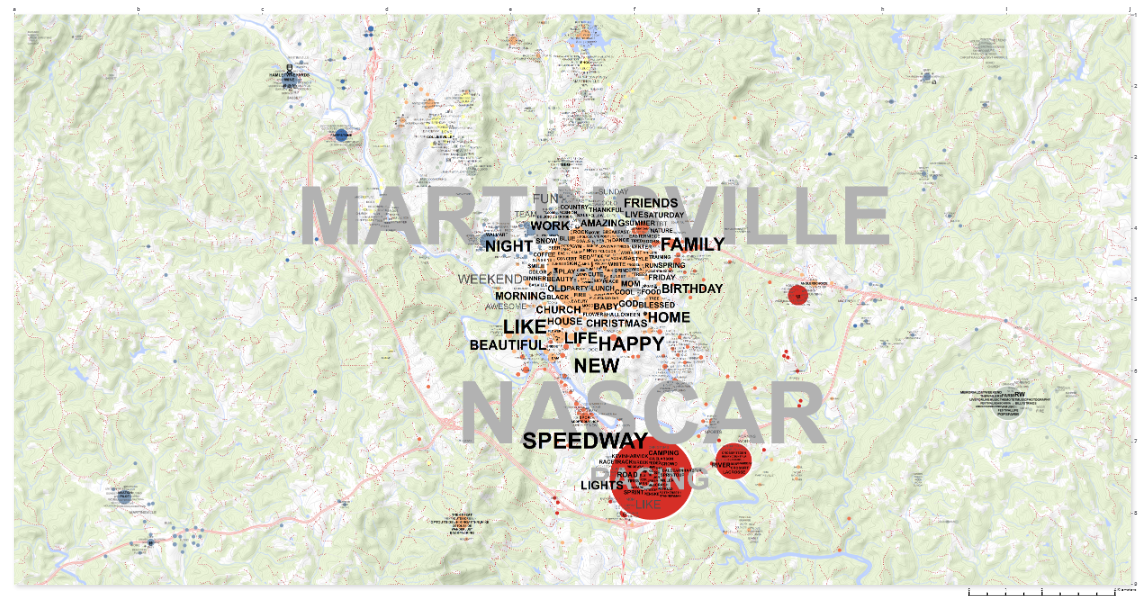
Mapping frequentation patterns for selected topics, similar to a “topic frequentation surface”:
- Nature-related topics (Martinsville and surrounding region): Map 1
- Urban-related topics (Martinsville city): Map 2
In the background, the algorithm first creates a “surface” (heat map) for all available social media posts, then for the selected topic (based on a set of terms), and afterwards normalizes the topic surface based on overall density.
Additional data is added from Facebook places dataset: For each topic cluster (derived from the tagmaps package), the most popular Facebook Place name is added as a label to the map.
Note that there’s only limited data available for Martinsville (21577 posts), so the results may contain quite some noise. Still, it appears possible to says that the close area in the South of Martinsville (e.g. Doe Run Park Trails) is quite important for nature-related leisure. Also, some outliers around Martinsville can be observed (Fairstone National Park, Rooster Walk, Chestnut Knob, Martinsville Reservoir). This information need verification with other data sources though.
Temporal patterns
This is the post count per day for the total available data for Martinsville region (Flickr and Instagram):
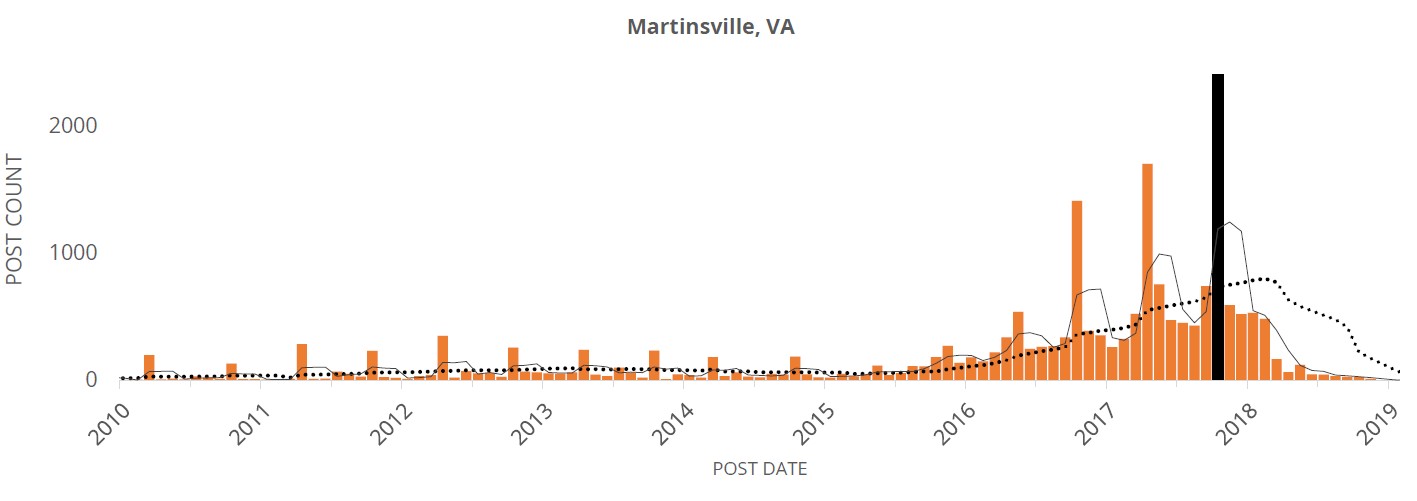
There appear to be two peaks per year, which relate to the nascar race events.
The peaks are (from right to left):
- 10/2017
- 04/2017
- 10/2016
- 05/2016
Tag Map
The PDF version of the map is available on request.
statistics:
- Total post count (PC): 22253
- Total tag count (PTC): 76918
- Total emoji count (PEC): 8092
- Total user count (UC): 6519
- Total user post locations (UPL): 9425
- Number of locations with names: 633 (Facebook Places)
- Total distinct tags (DTC): 14673
- Total distinct emoji (DEC): 872
- Total distinct locations (DLC): 2231