Publication: From sunrise to sunset

The final paper was published!
Abstract
Events profoundly influence human-environment interactions. Through repetition, some events manifest and amplify collective behavioral traits, which significantly affects landscapes and their use, meaning, and value. However, the majority of research on reaction to events focuses on case studies, based on spatial subsets of data. This makes it difficult to put observations into context and to isolate sources of noise or bias found in data. As a result, inclusion of perceived aesthetic values, for example, in cultural ecosystem services, as a means to protect and develop landscapes, remains problematic. In this work, we focus on human behavior worldwide by exploring global reactions to sunset and sunrise using two datasets collected from Instagram and Flickr. By focusing on the consistency and reproducibility of results across these datasets, our goal is to contribute to the development of more robust methods for identifying landscape preference using geo-social media data, while also exploring motivations for photographing these particular events. Based on a four facet context model, reactions to sunset and sunrise are explored for Where, Who, What, and When. We further compare reactions across different groups, with the aim of quantifying differences in behavior and information spread. Our results suggest that a balanced assessment of landscape preference across different regions and datasets is possible, which strengthens representativity and exploring the How and Why in particular event contexts. The process of analysis is fully documented, allowing transparent replication and adoption to other events or datasets.
Citation
Dunkel, A., Hartmann, M. C., Hauthal, E., Burghardt, Dirk, & Purves, R. S. (2023). From sunrise to sunset: Exploring landscape preference through global reactions to ephemeral events captured in georeferenced social media. PLoS ONE, 17(1). DOI
The repository contains all Jupyter notebooks to reproduce the paper and results.
I also made a demo available on how to use the data provided as supplementary materials.
Repository: Flickr Sunset Sunrise grid aggregation & chi
The notebooks are stored as markdown files with jupytext for better git compatibility.
These notebooks can be run with CartoLab Docker.
Results
In addition to the resource folder, the latest HTML converts of notebooks are also available here:
- 01_grid_agg.html
- Results: 16 static maps for Instagram and Flickr (Sunrise + Sunset) and Flickr Totals, absolute User Count, Post Count and User Days
- 02_visualization.html
- Results: Interactive Visualization using Bokeh, with most popular Flickr CC Images shown on hover
- Example outputs:
- Absolute User Days Flickr Sunset
- Absolute User Days Flickr Sunrise with CC Images on Hover
- 03_chimaps.html
- Results: Chi maps for Flickr and Instagram Sunset and Sunrise, for User Count and User Days, and for Natural Breaks and Head Tail Breaks classification schemes, excluding non-significant chi values
- Outputs:
- with non-significant:
- without non-significant:
- User Count:
- Flickr Sunset chi (Natural Breaks)
- Flickr Sunrise chi (Natural Breaks)
- Instagram Sunset chi (Natural Breaks, Instagram Random 20M as expected)
- Instagram Sunrise chi (Natural Breaks, Instagram Random 20M as expected)
- Instagram Sunset chi (Natural Breaks, Flickr Totals as expected)
- Instagram Sunrise chi (Natural Breaks, Flickr Totals as expected)
- User Days:
- Post Count:
- User Count:
- 04_combine.html
- Results: Merged chi values (positive), to combine Instagram and Flickr results for comparison
- Outputs:
- Head Tail Breaks:
- Flickr Post Count
- Flickr User Days
- Flickr User Count
- Instagram Post Count (Sunset+Sunrise as expected)
- Instagram User Days (Sunset+Sunrise as expected)
- Instagram User Count (Sunset+Sunrise as expected)
- Instagram Post Count (Flickr Totals as expected)
- Instagram User Days (Flickr Totals as expected)
- Instagram User Count (Flickr Totals as expected)
- Instagram Post Count (Instagram Random 20M as expected)
- Instagram User Days (Instagram Random 20M as expected)
- Instagram User Count (Instagram Random 20M as expected)
- Natural Breaks:
- Flickr Post Count
- Flickr User Days
- Flickr User Count
- Instagram Post Count (Sunset+Sunrise as expected)
- Instagram User Days (Sunset+Sunrise as expected)
- Instagram User Count (Sunset+Sunrise as expected)
- Instagram Post Count (Flickr Totals as expected)
- Instagram User Days (Flickr Totals as expected)
- Instagram User Count (Flickr Totals as expected)
- Head Tail Breaks:
- 05_countries.html
- Results: Country aggregate chi values, also for producing relationship plots
- Outputs:
- 06_semantics.html
- Results: Visualization of cosine similarity and tf-idf values for countries
- Output: Map for Uganda (UGA)
- Output: Map for Uganda (IDN)
- Output: Map for Uganda (ZMB)
- 07_time.html
- Temporal aggregate data per month, for Flickr and Instagram
- 08_relationships.html
- Relationship plots for comparison:
- Flickr Sunrise + Flickr Sunset
- Instagram Sunrise + Instagram Sunset (Flickr expected)
- Sunrise Flickr + Sunrise Instagram
- Sunset Flickr + Sunset Instagram
- and a test with Instagram Sunset+Sunrise as expected
- For comparison, we also created these relationship plots for the chi values for each country: Relationship chi plots for comparison. Albeit interesting, there was not enough space in the paper to discuss these results.
- Relationship plots for comparison:
- 09_statistics.html
- Total aggregates, Summary Statistics
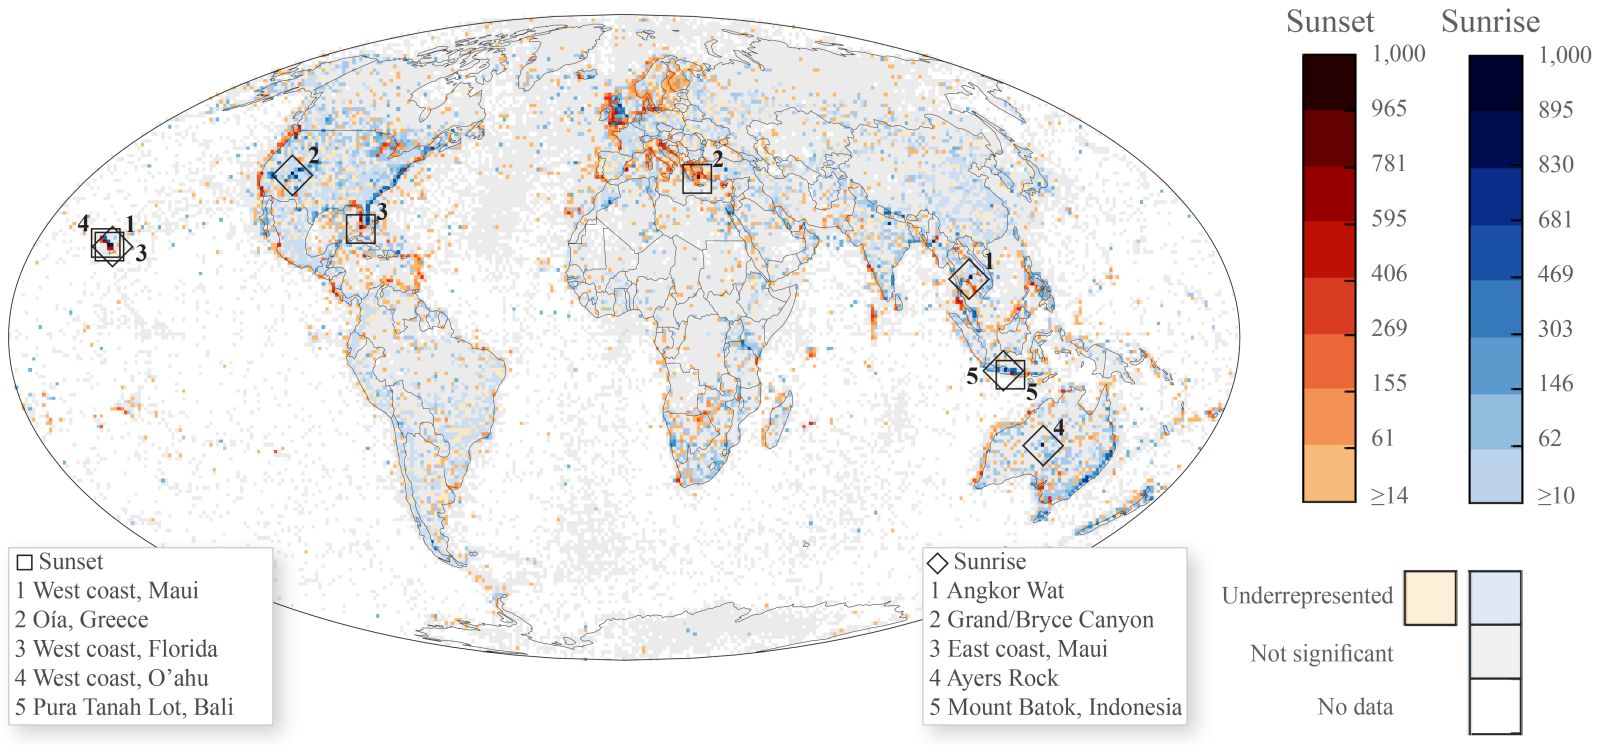
Among other outputs, there are two core result maps produced in notebooks:
Convert to ipynb files
First, either download release files or convert the markdown files to working jupyter notebooks.
To convert jupytext markdown files to ipynb-format:
If you’re using the docker image, open a terminal inside jupyter and follow these commands:
bash
conda activate jupyter_env && cd /home/jovyan/work/
Afterwards, re-create the .ipynb notebook(s) with:
mkdir notebooks
jupytext --set-formats notebooks///ipynb,md///md,py///_/.py --sync md/01_grid_agg.md
jupytext --set-formats notebooks///ipynb,md///md,py///_/.py --sync md/02_visualization.md
jupytext --set-formats notebooks///ipynb,md///md,py///_/.py --sync md/03_chimaps.md
jupytext --set-formats notebooks///ipynb,md///md,py///_/.py --sync md/04_combine.md