Exploration of temporal statistics for Biodiversity Hotspots
What a blessing it is to hav parametrized code: Just a day after studying temporal patterns for Nationalpark Subreddits, I was looking into Biodiversity Hotspots in Germany, with the goal to get an overview of monthly average visitor counts for various social media platforms.
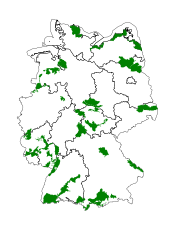
Here, I first intersected Geo-Social Media posts from various sources (Instagram, Flickr, Twitter, iNaturalist) with the boundaries of the following 30 Biodiversity Hotspots in Germany:
Afterwards, I used HyperLogLog and a stacked bar plot to visualize aggregate data per Hotspot.

Thanks to matplotlib, the plot is available as svg, allowing seamless zooming-in.
All graphics are available in a jupyter notebook.