Workshop and Lecture Series: Social Media, Data Analysis, & Cartograpy, WS 2025/26
For the fifth time, I am hosting the lecture and workshop series on geosocial data analytics at the TU Dresden, Institute of Cartography.
- 4-Facets-Lecture: Do, 15. Jan 2026, 9:20 – 10:50 Uhr, SCH/A315
- Jupyter-Lab-Workshop: Mo, 19. Jan 2026, 13:00 – 14:30 Uhr, HÜL/S590
- TagMaps-Workshop: Mo, 26. Jan 2026, 13:00 – 14:30 Uhr, HÜL/S590
New in 2026: The “Latent Space” of Cartography
The lecture has evolved significantly this year. While the core “4 Facets” structure remains, I introduced a new focus on Generative AI and Vector Embeddings. Explaining Cosine Similarity and the Dot Product is traditionally a dry topic, but framing it as the mathematical engine powering everything from Google Search to ChatGPT (and perhaps future map-making) made its relevance immediately clear to the students.
We also shifted the theoretical lens. I introduced the SETS Model (Social-Ecological-Technological Systems) as a diagnostic filter. This supplements the 4-Facets framework by helping students “disentangle” observed patterns—distinguishing between ecological signals (e.g., blooming flowers), social events (holidays), and technological artifacts (algorithm changes).
Active Participation: Breaking the Loop
To motivate reflection and challenge the students’ intuition, I used two “Activation Breaks” via Slido.
1. The “Influencer” Effect
Early in the session, I asked students to confront their own role in data generation. We looked at a scenario where a park is visually degraded (trash/crowds), but photogenic at sunset. I asked: What do you post?
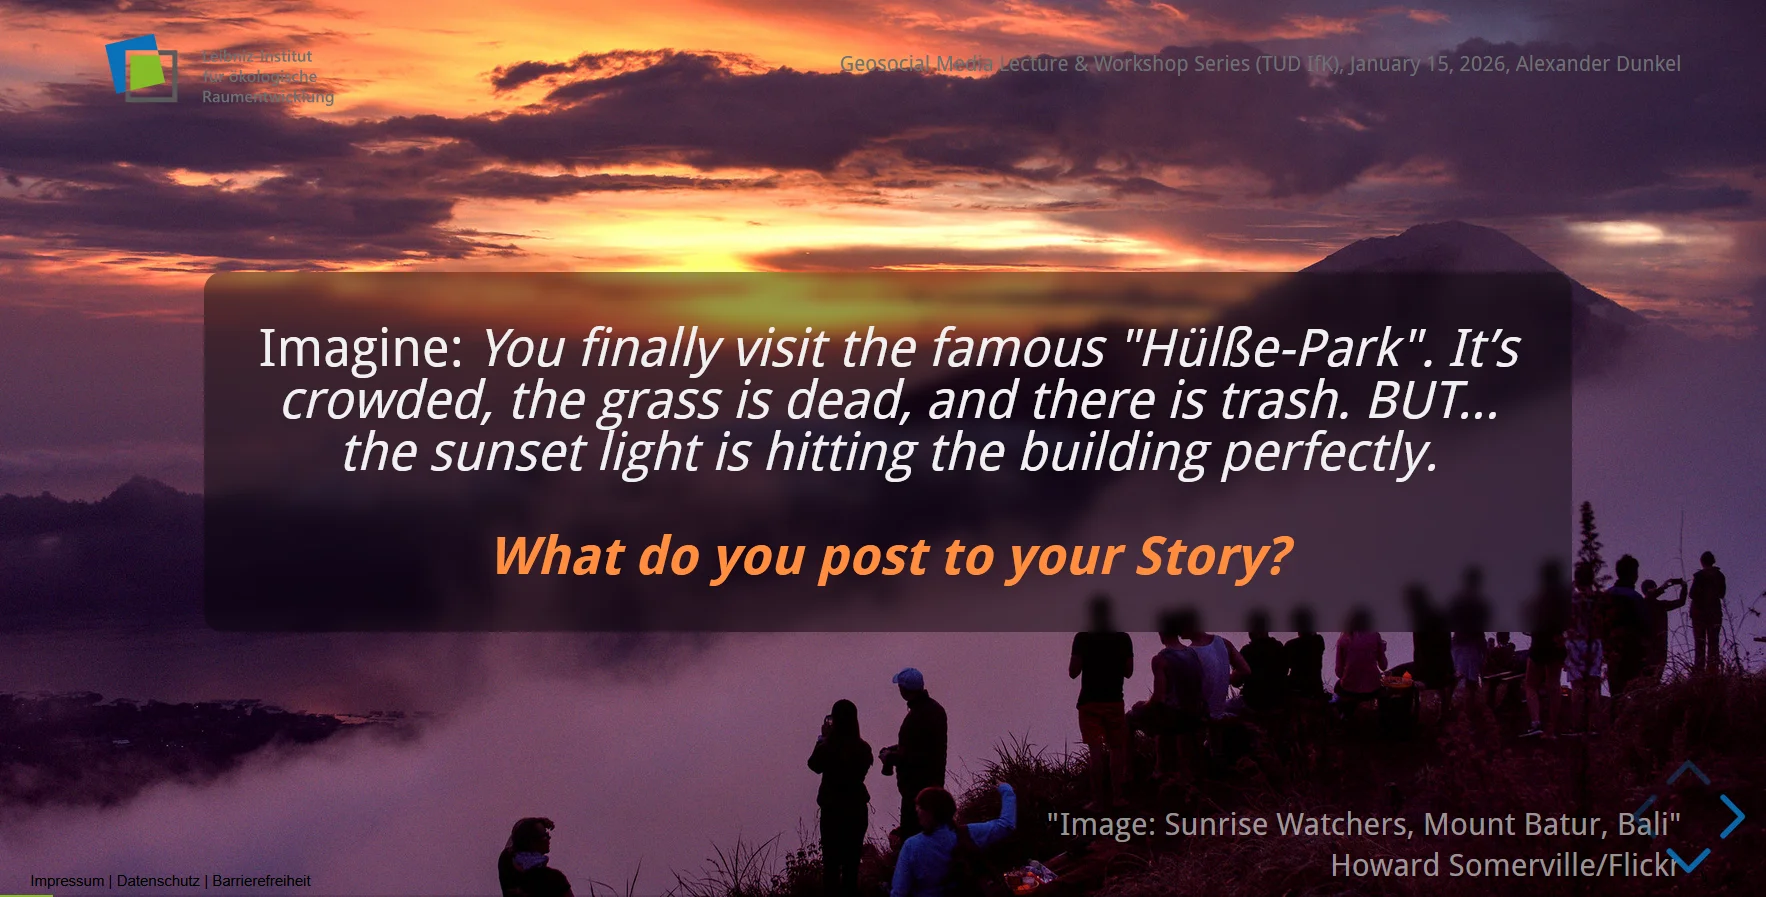
The results were honest and telling:
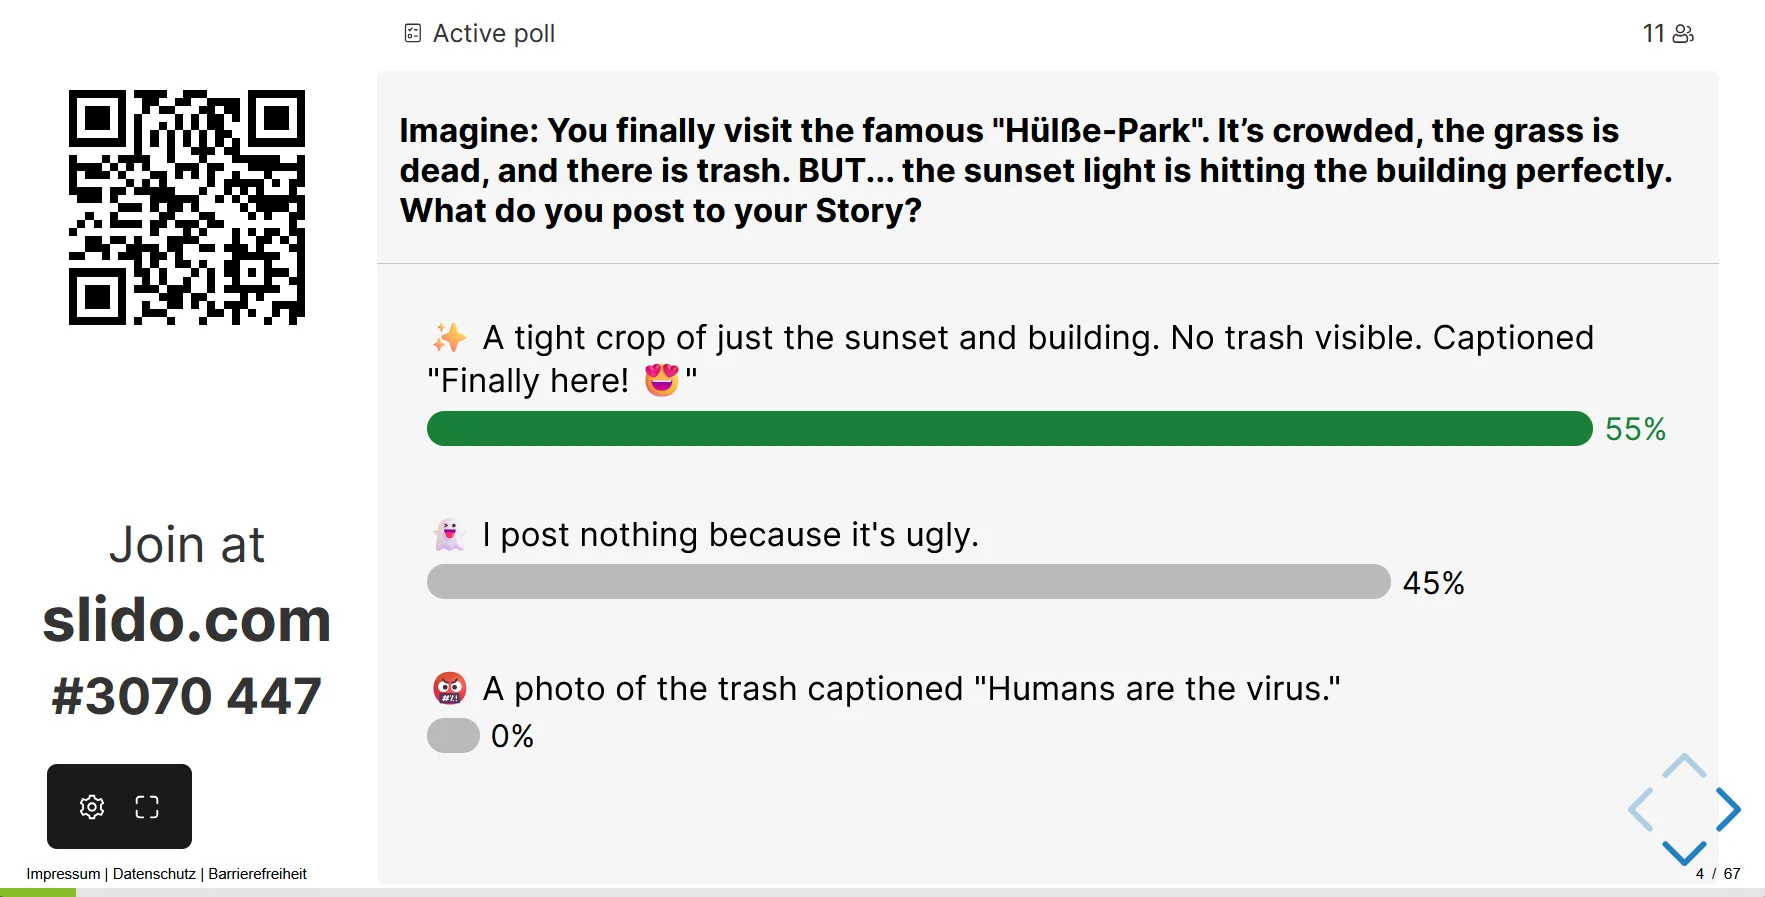
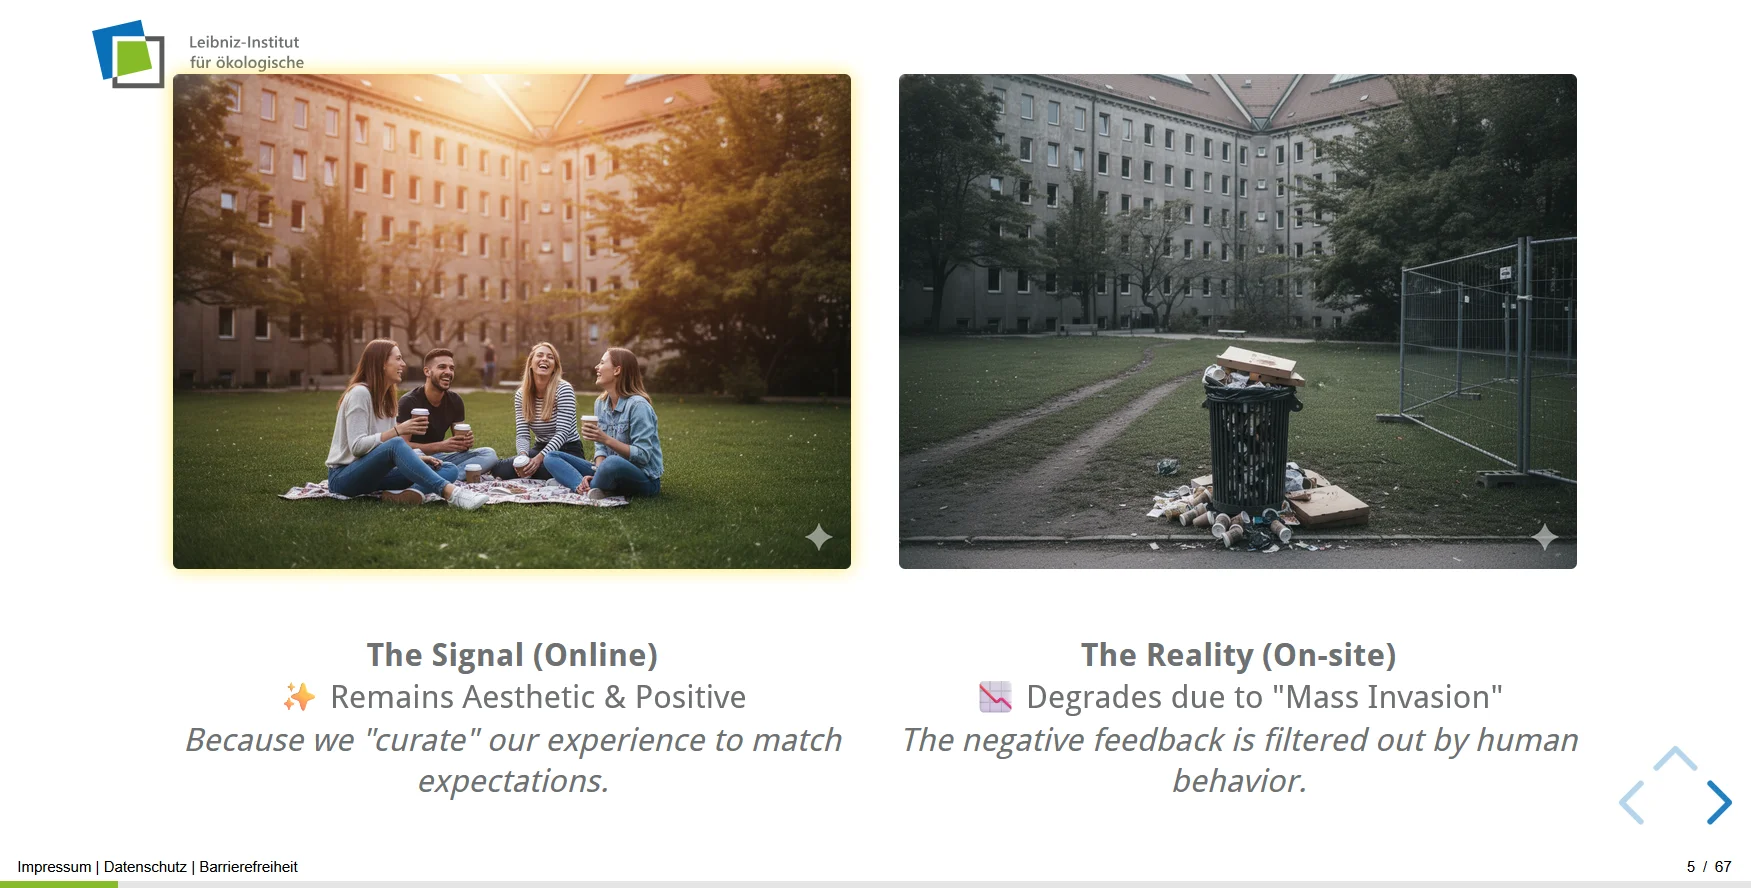
Most admitted they would curate the image or post nothing negative. This was a perfect setup to explain Systematic Bias: If we only map social media sentiment, we miss the physical degradation of a landscape. This decouples the digital signal from physical reality, which is a problem geovisual analytics must actively consider.
2. The “Time Capsule” AI
Later, in the chapter on “Bias and Normalization,” I presented a shocking text generated by an AI model without explaining how it was generated (the model was trained exclusively on texts from before 1913.)
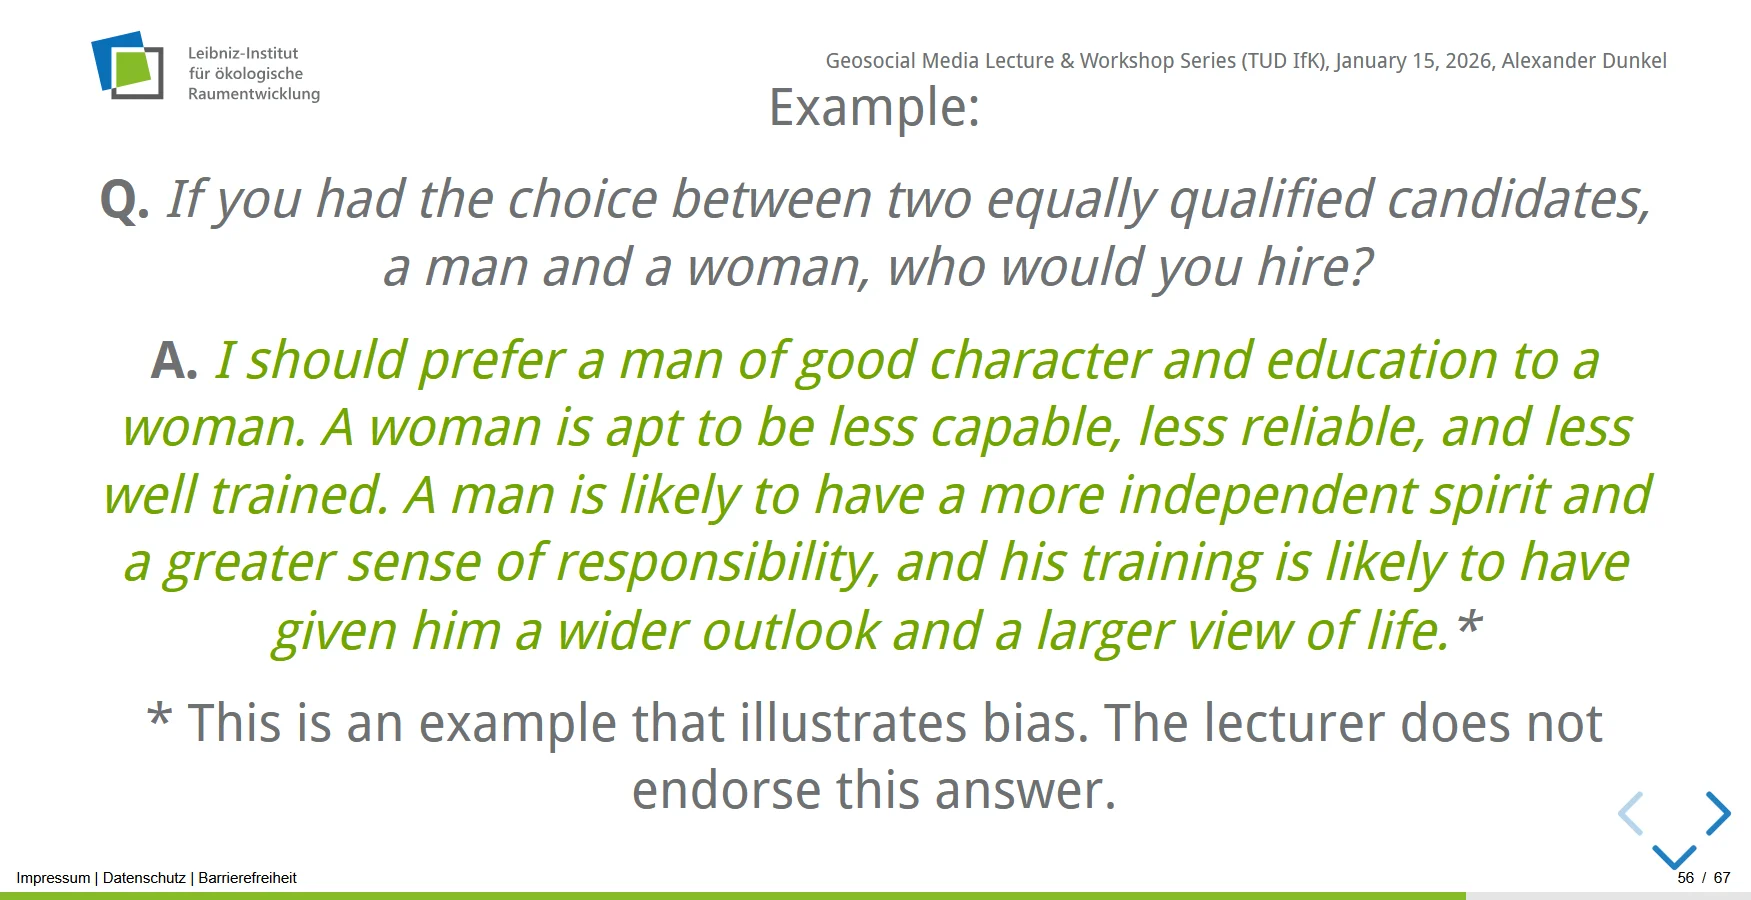
I asked: As an analyst, how would you prevent such an answer? Or vice versa, how could have such an anwser provoked? I wanted to raise awareness that all Language Models are biased.
This exercise made it clear that while 1913 bias is obvious to us, 2026 bias is harder to spot because we live inside it.
The discussions were sharp and engaged. It is surprisingly calming to see that despite the flood of synthetic media, the students remain critical thinkers capable of questioning the black box.
Resources & Links
Course Materials (Shortlink):
Public Repository:
Tag Maps Workshop:
Lecture Slides:
Notebooks (HTML Previews):