Tutorial
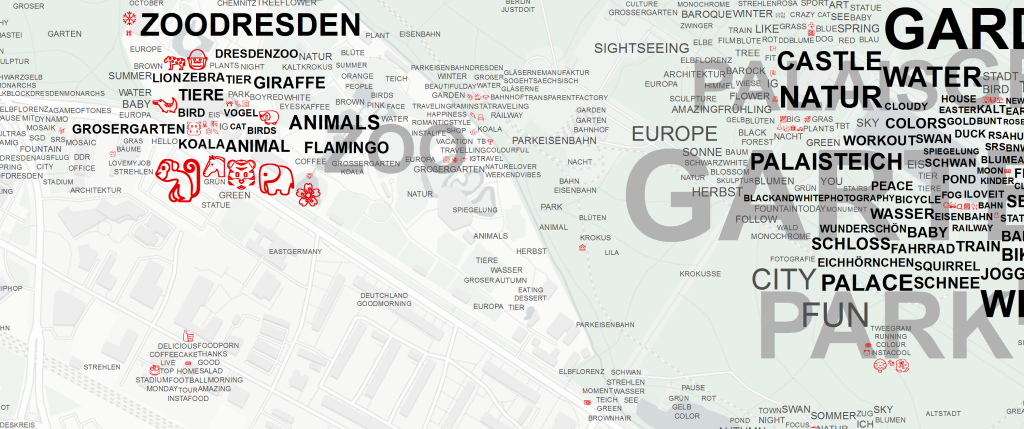
We'll create a Tag Map for Dresden from about 500.000 spatially referenced publicly available Social Media Photos (and emoji).
Note
This tutorial is part of a workshop & lecture series and is also available as Jekyll reveal slides.
Tag Maps Summary
- These maps can be created for any scale and area, depending on data availability and a predefined granularity of information.
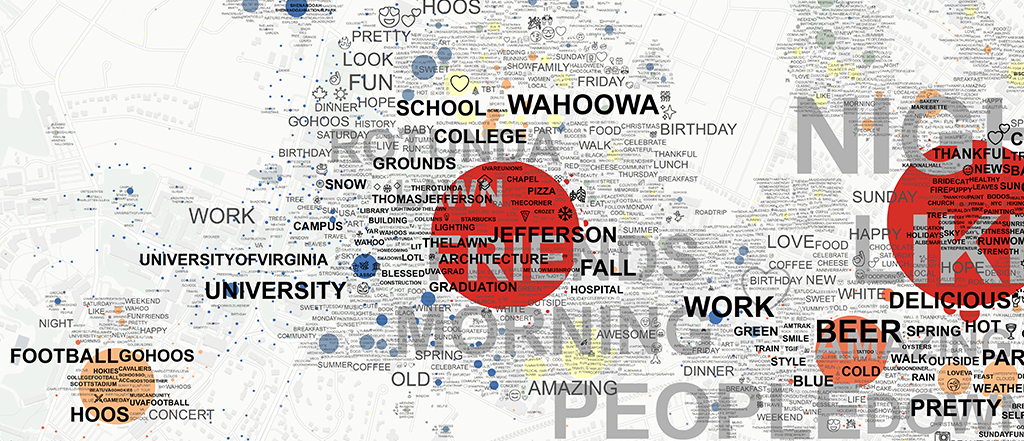
- Some example maps on maps.alexanderdunkel.com. A paper (Dunkel, 2015) explains the conceptual and programmatic background.
- Also check out some additional information provided on my blog.
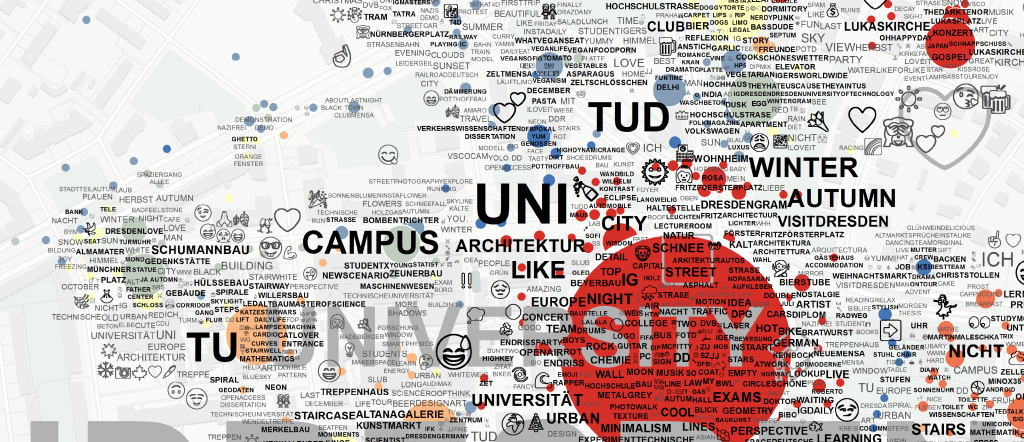
Emoji Tag Map TUD Campus
For Tag Maps, the general idea is that tags & emoji are
- placed on the map according their (collective) area of use and
- scaled based on the overall number of people using respective tags/emojis.
Note
This means that Tag Maps are scale dependent. In other words, data must be clustered again each time a new scale or area is explored.
Tutorial Setup
- Most current version of slides available here
- Base Data and tools for Workshop:
- Either the compiled Tag Maps Package for Windows: see latest release on Github
- or
conda install tagmaps(pip install tagmaps) - Tagmaps resource folder, including ArcGis map template
Please bring your own data or use a sample from the YFCC100M Flickr Commons Dataset.
Base Data
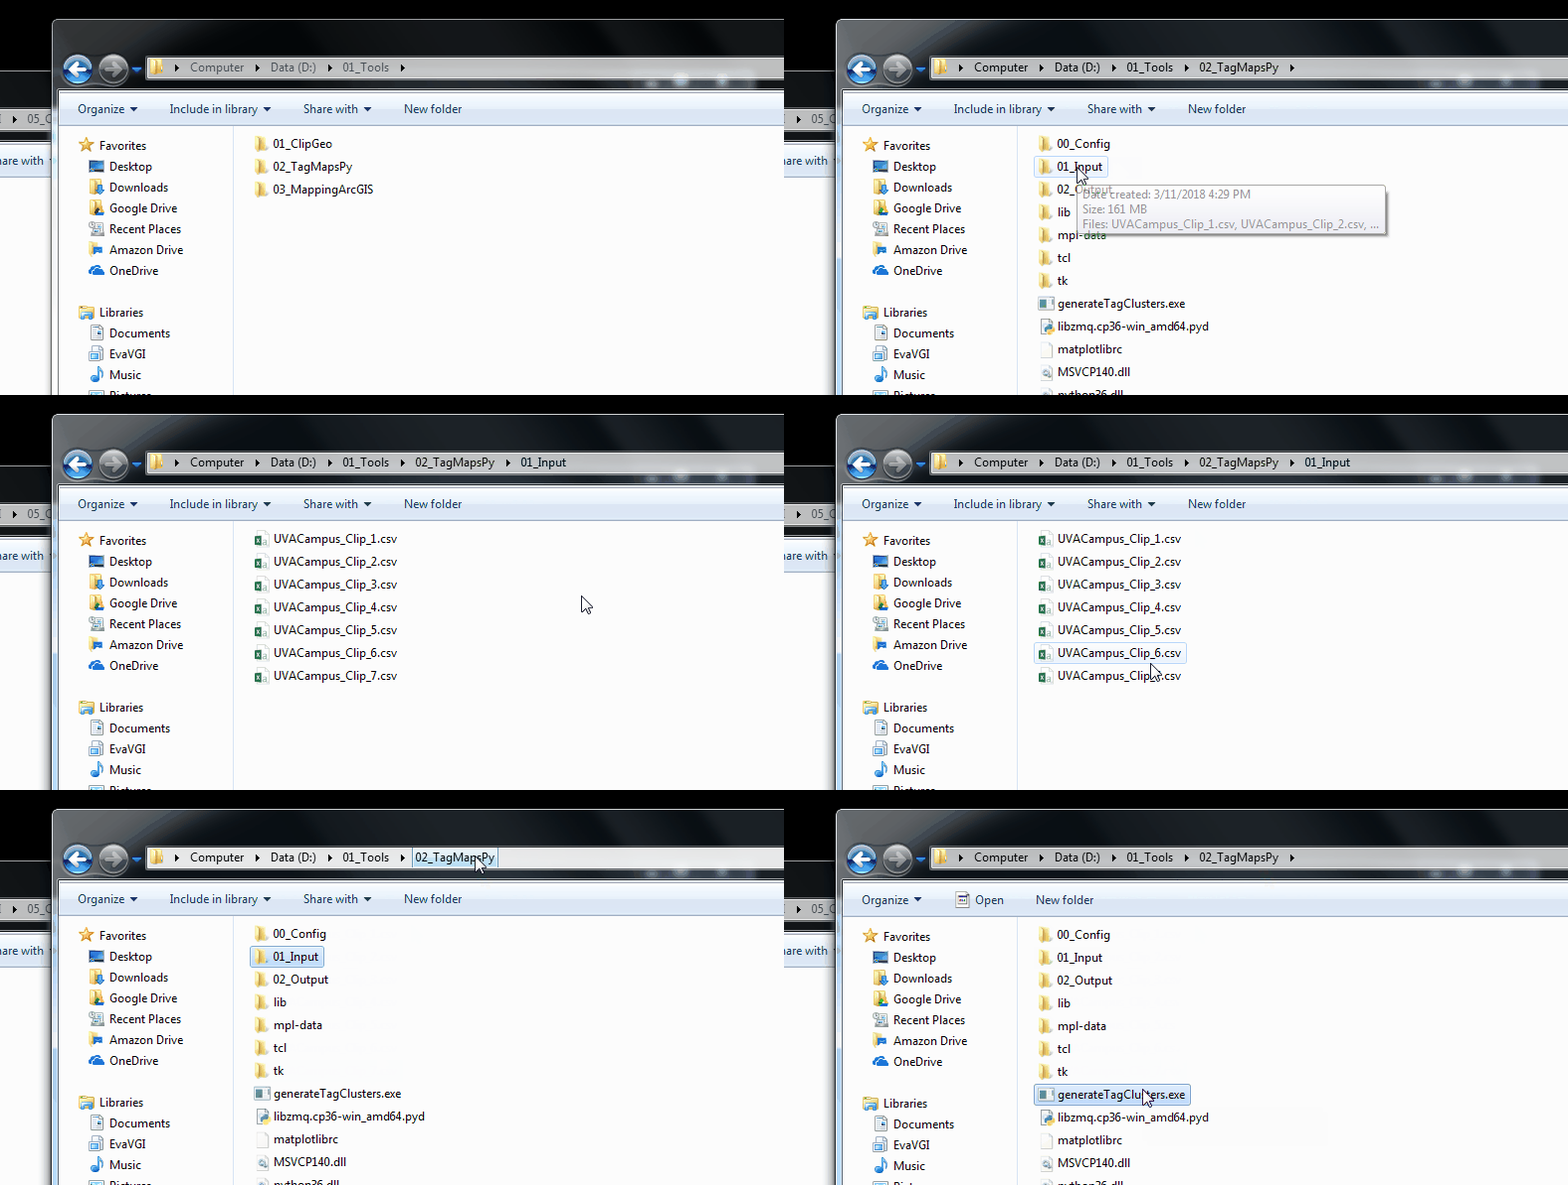
Have a look at the Base Data (Instagram & Flickr) stored in folder \01_Input\
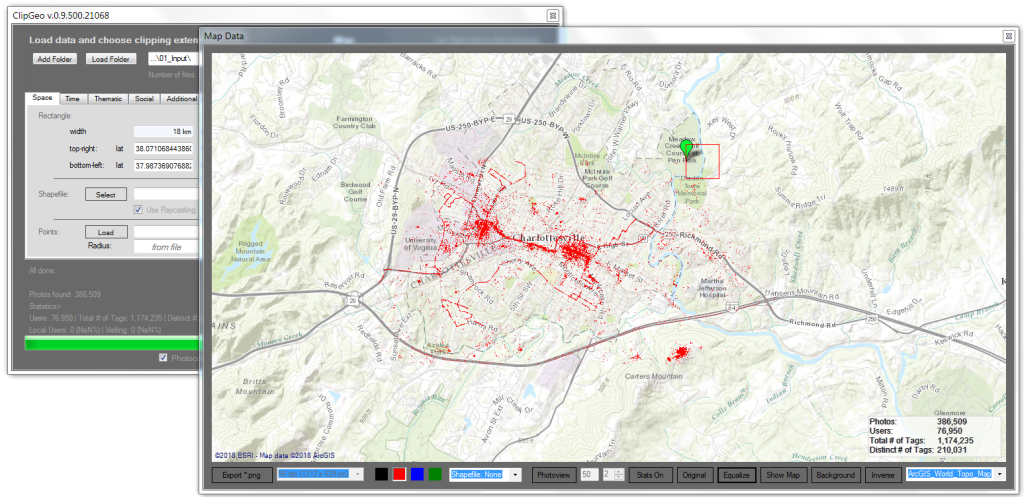
This data was retrieved from publicly availabe Social Media API endpoints (e.g. Flickr, Twitter, Instagram) and clipped using ClipGeo.
Load Data
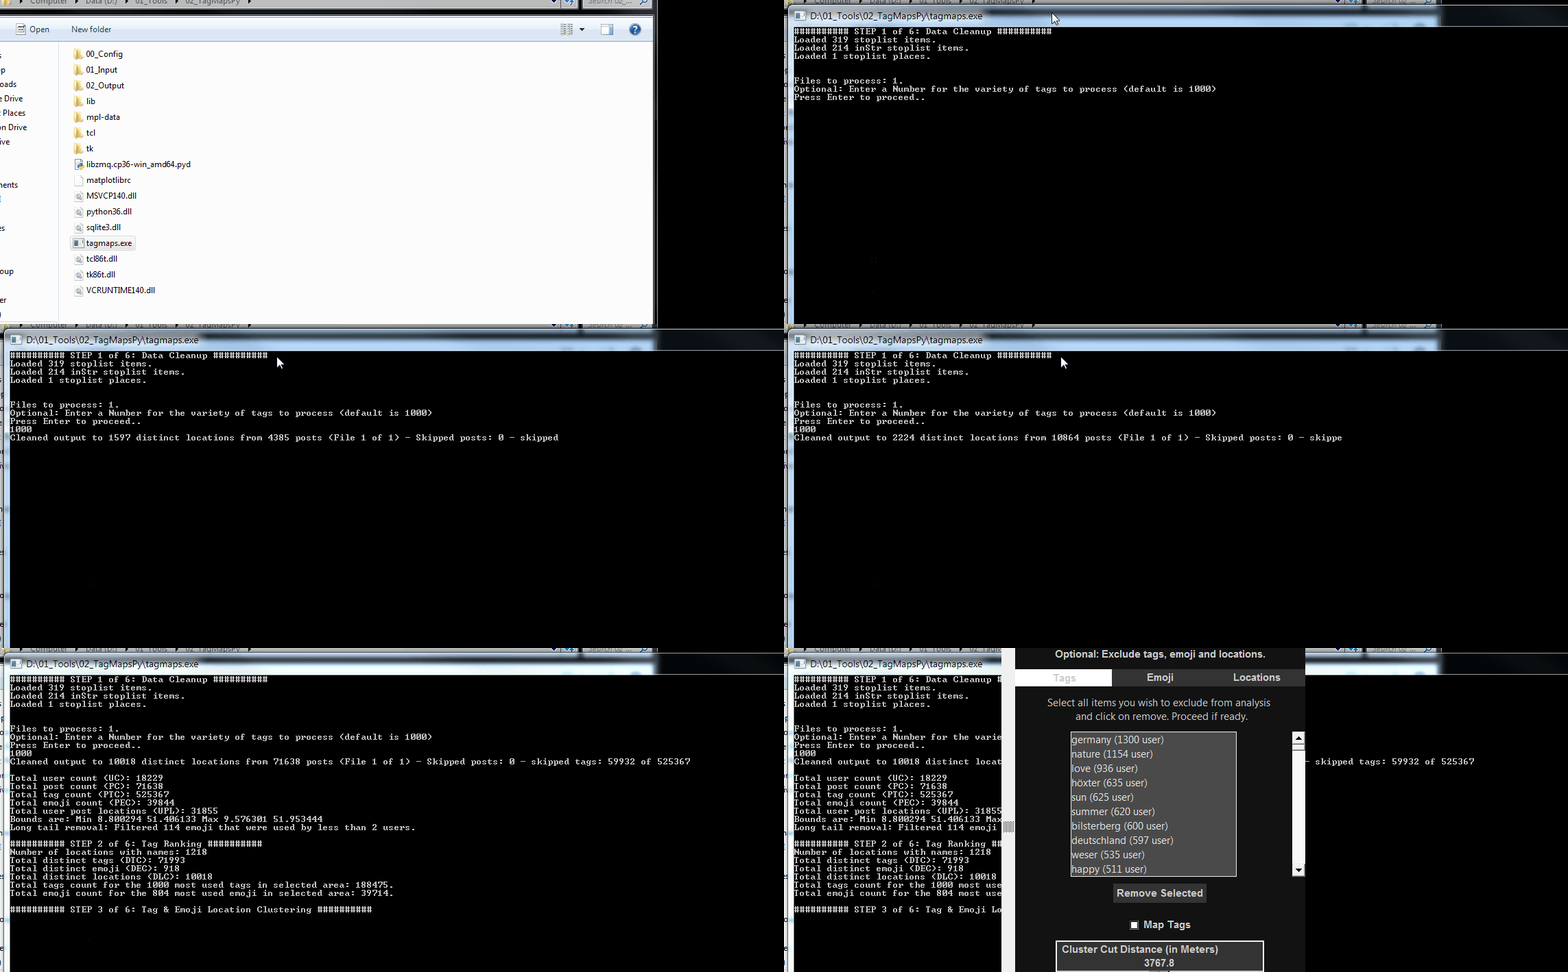
To start the tool, open /tagmaps.exe (or use tagmaps if you've installed the package)
After starting the tool, it will read all files in 01_Input folder. Optionally, specify a range of unique tags to be processed. This is set to 1000 by default, meaning the tool will cluster the top 1000 used tags in data.
After the tool has cleaned up base data, an interface will open with the list of top tags found.
Optional: Remove Tags
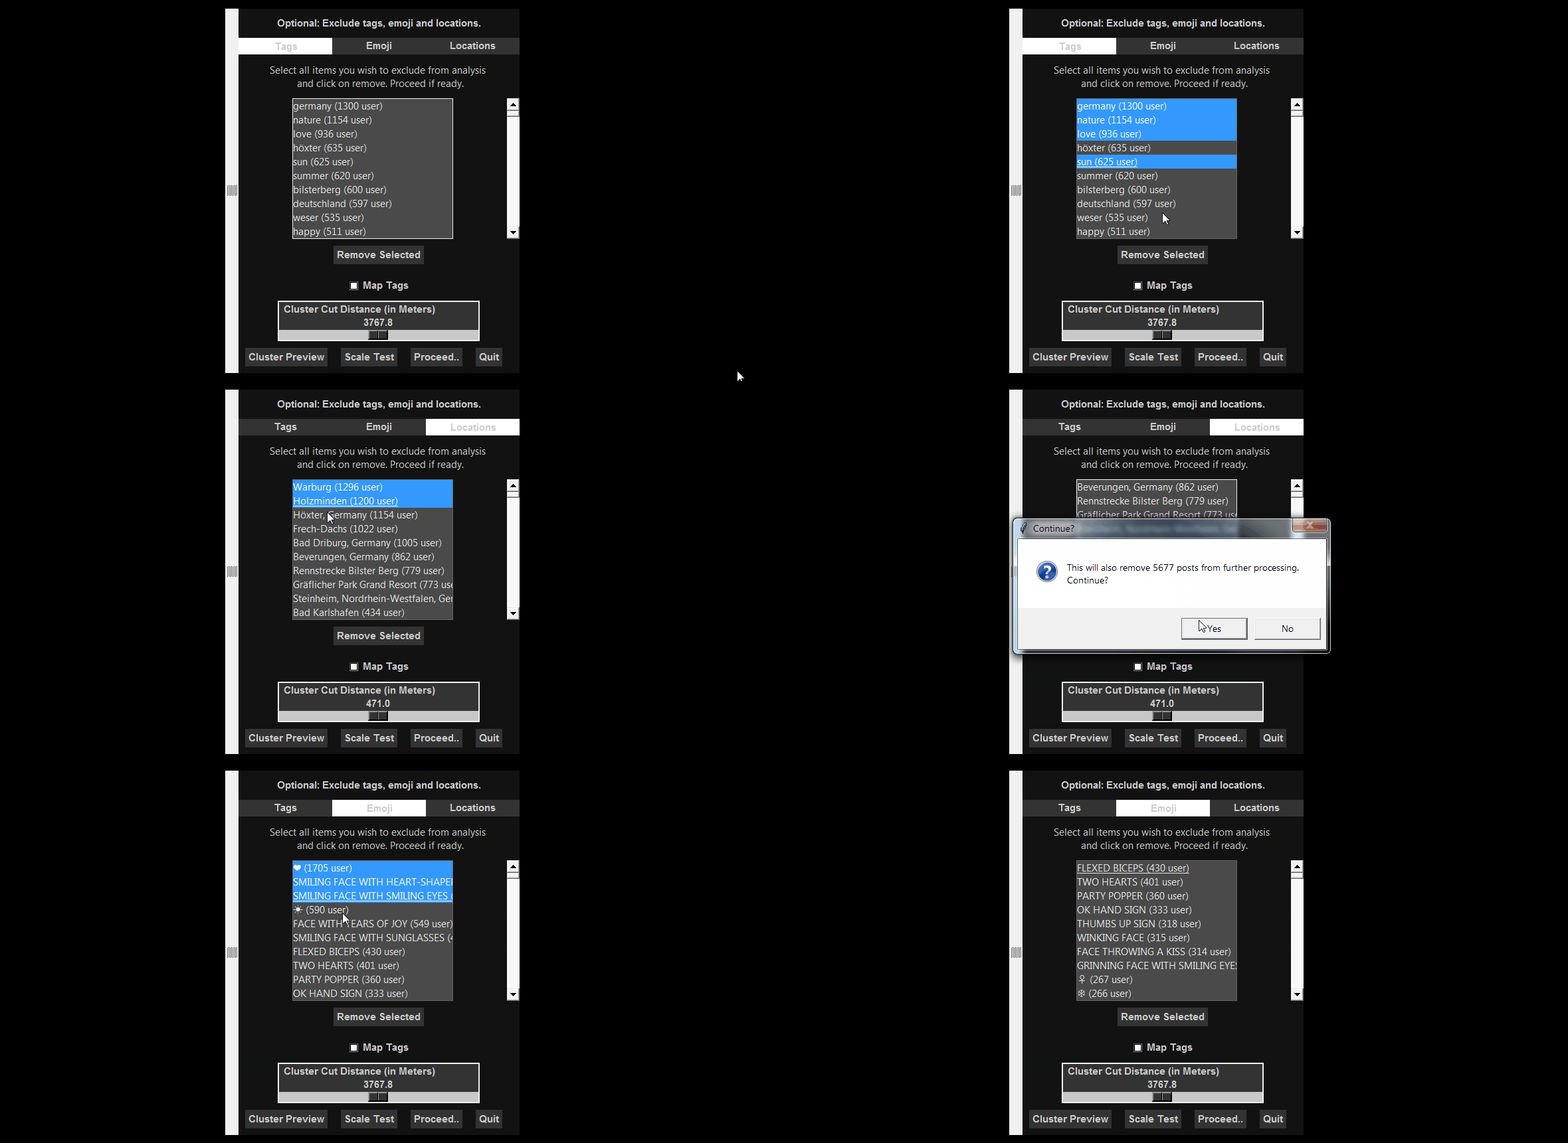
At this point, we can remove unwanted tags (+ emoji, or locations) that are uninteresting for the current scale or for the specific context of investigation.
Usually, the first few tags refer to general aspects for the area and provide little information. These tags can be removed, to focus on more locally relevant topics.
Optional: Preview Tags on Map
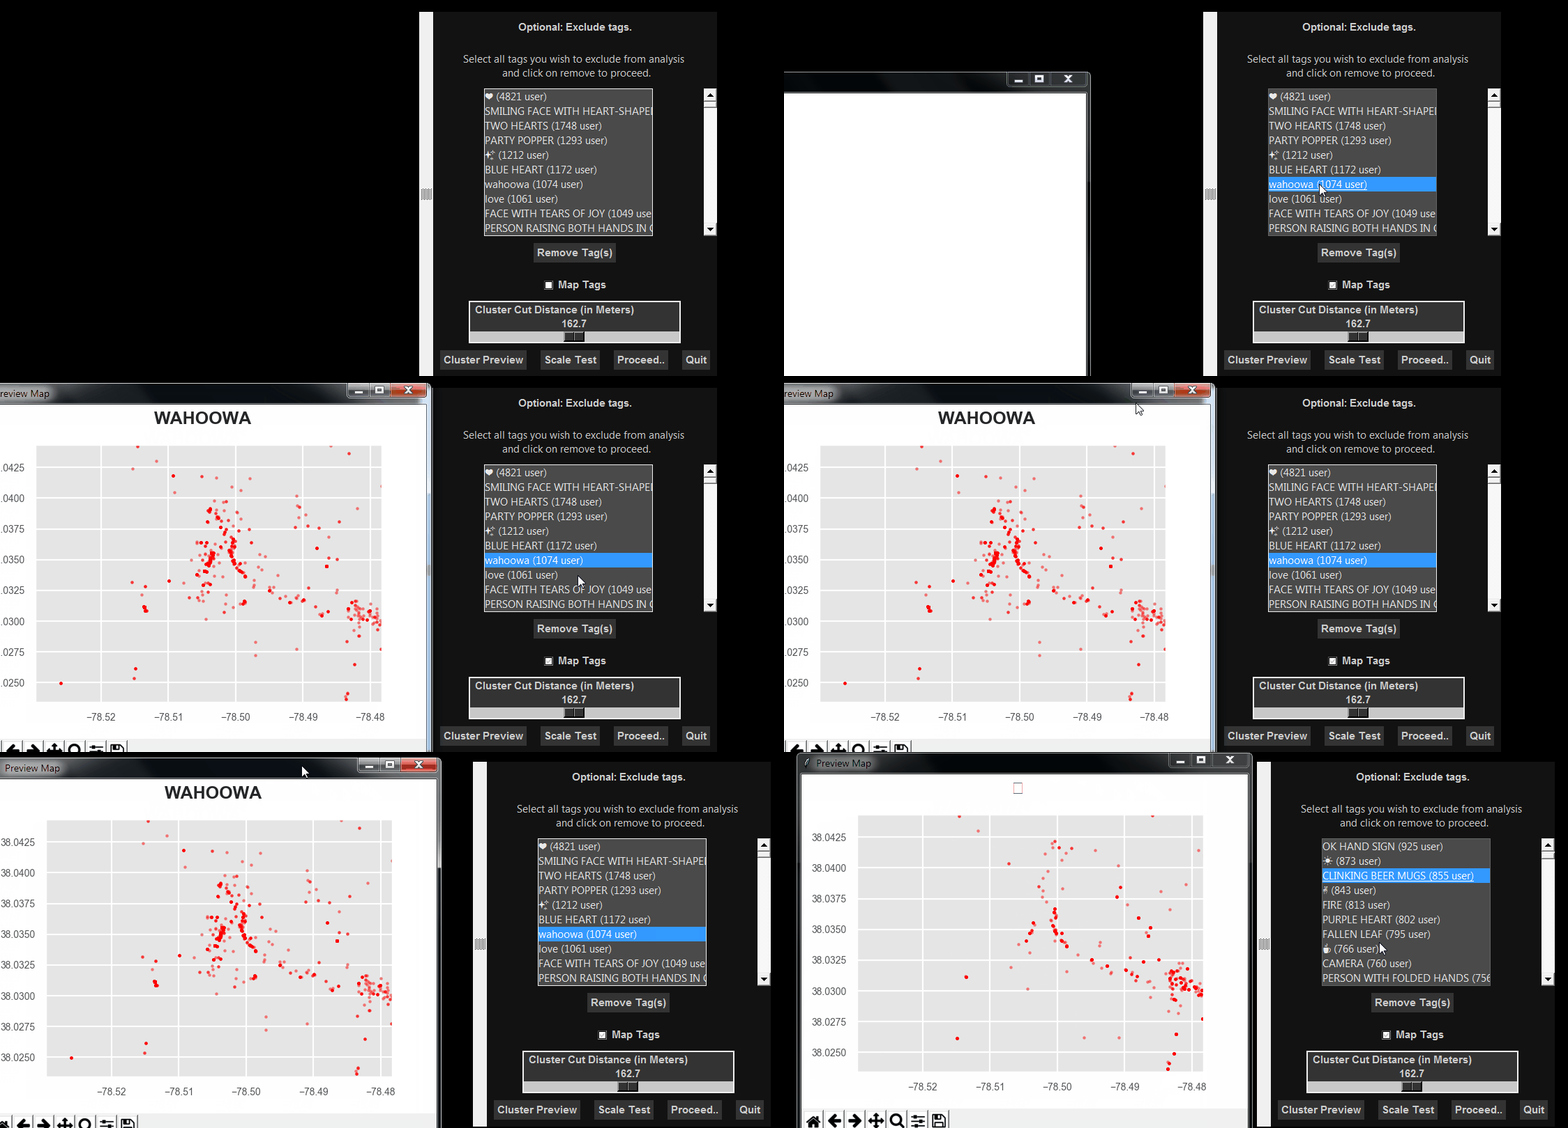
Check "Map Tags" and select a tag. A preview map will be generated showing the general distribution of the current tag.
Note
Most emoji are referenced with their Unicode_Name, not the actual symbol.
Adjust cluster granularity
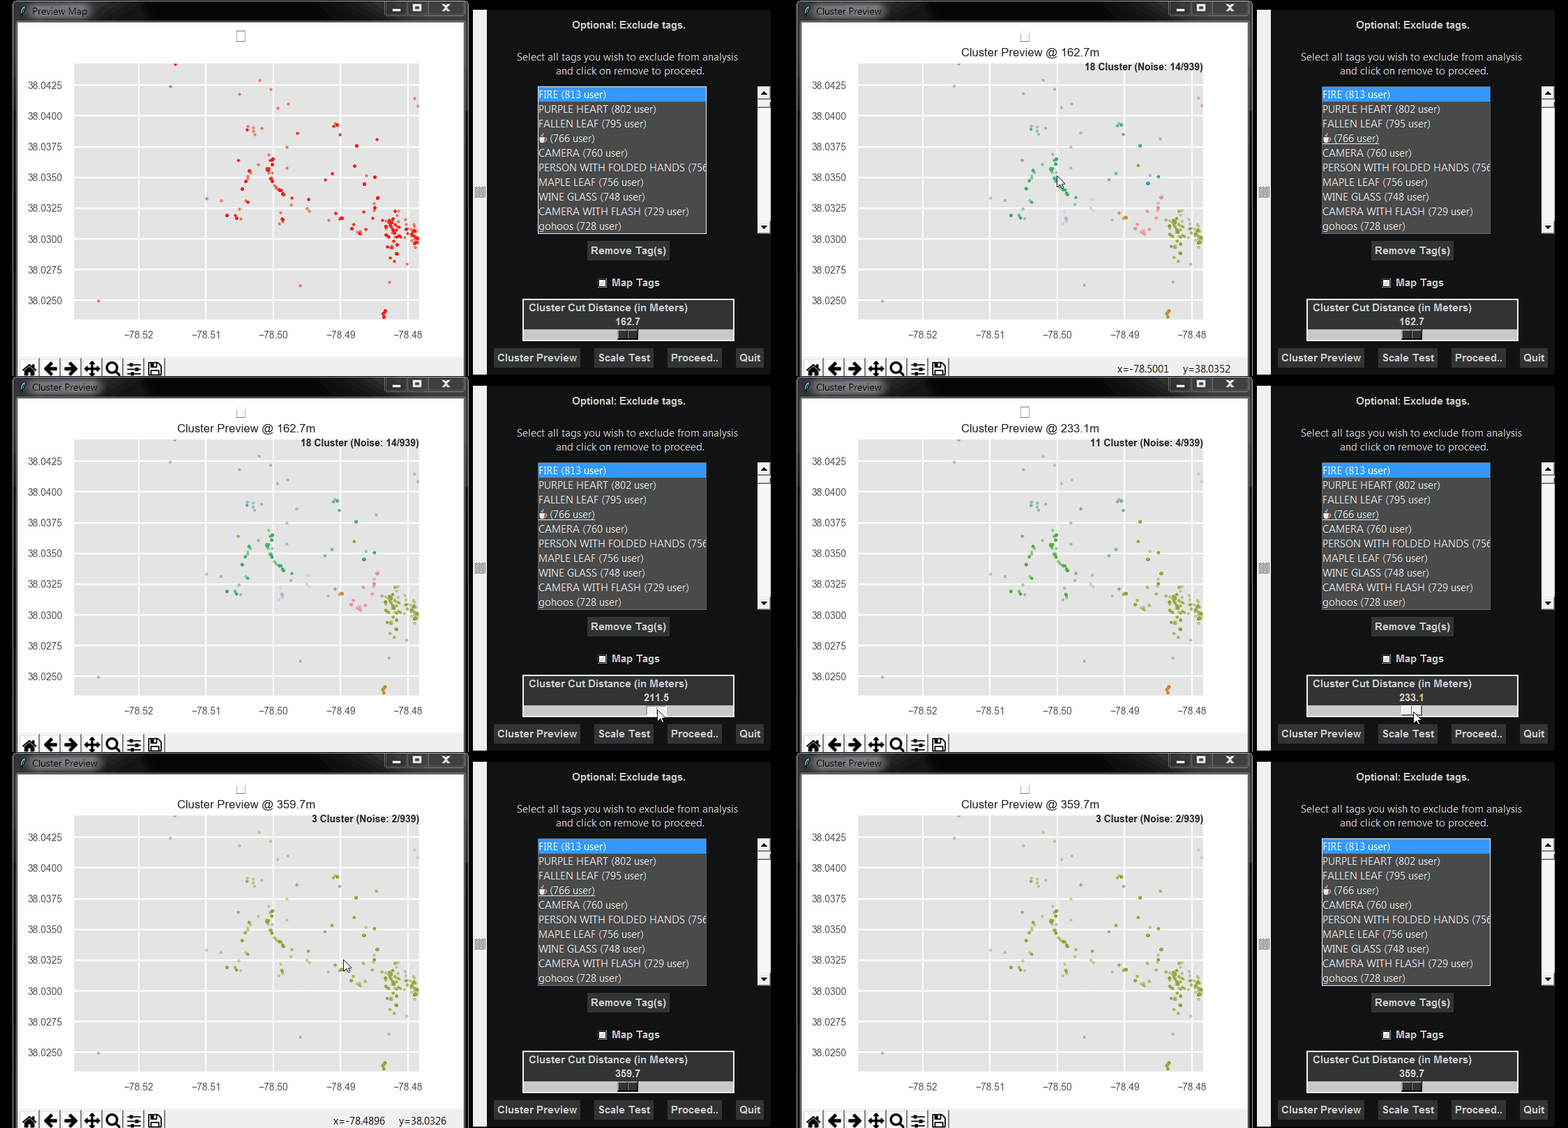
Cluster granularity affects how detailed or clustered a Tag Map appears. The default distance is calculated from the current scale, but can be adjusted to personal needs.
Note
Cluster granularity significantly affects the resulting map. For small datasets (<30.000 photos) larger distances are recommended, otherwise only few clusters will be found. For large datasets (>100.000) leave as is or reduce cluster granularity.
Default values are calculated using the given analysis extent (and usually produce ok result). Fine-tune only if needed. Cluster Distance can be defined independently for tags, emoji and locations.
Cluster data
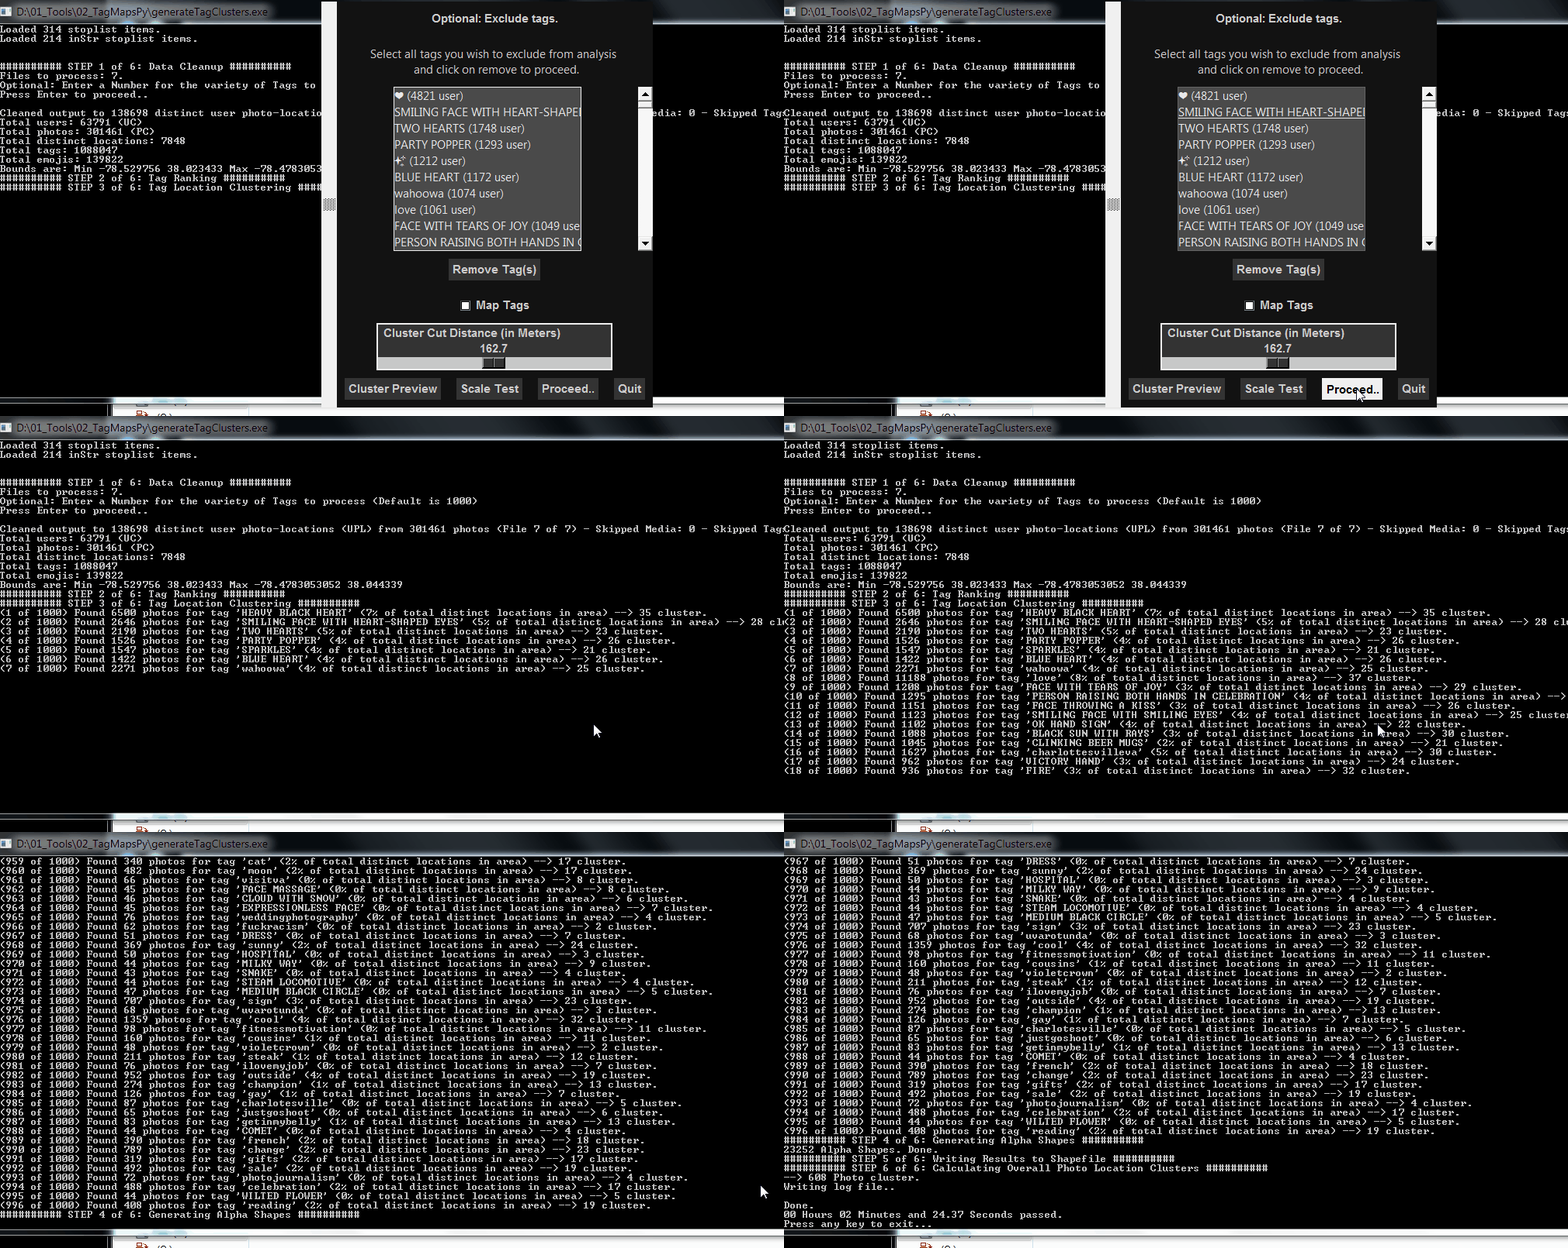
Click on proceed to cluster data..
The tool will process each unique tag separately. The clustering is implemented using the single-linkage tree that is available from HDBSCAN. In short, all cluster trees (Dendrograms) for tags will be cut at the same distance, so that their patterns can be compared for the given scale.
Note
HDBSCAN is a fast single-linkage clustering technique that is designed in a bottom-up manner, meaning that patterns mostly emerge from underlying data (and not the researcher's definition of input criteria). For tagmaps, this is important because it allows processing data automatically and equally, without the need for additional input criteria from the researcher.
Results
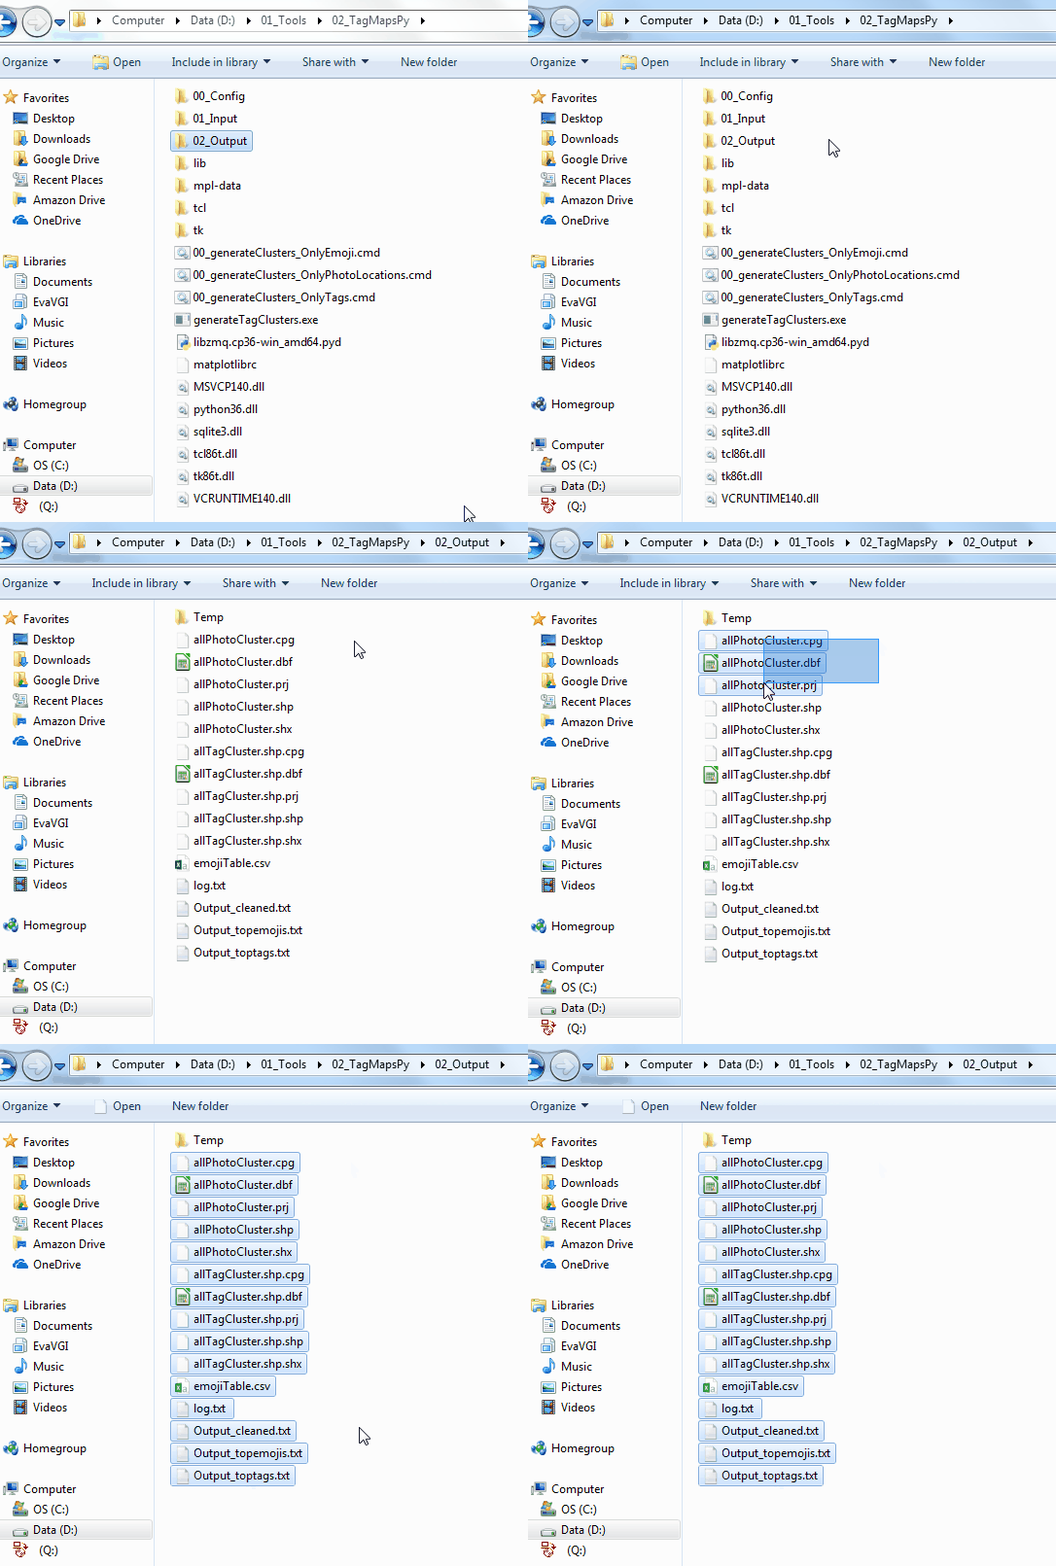
Results will be saved to \02_Output\
A number of additional files provide some statistics:
- Output_cleaned.txt
- Output_topemojis.txt
- Output_toptags.txt
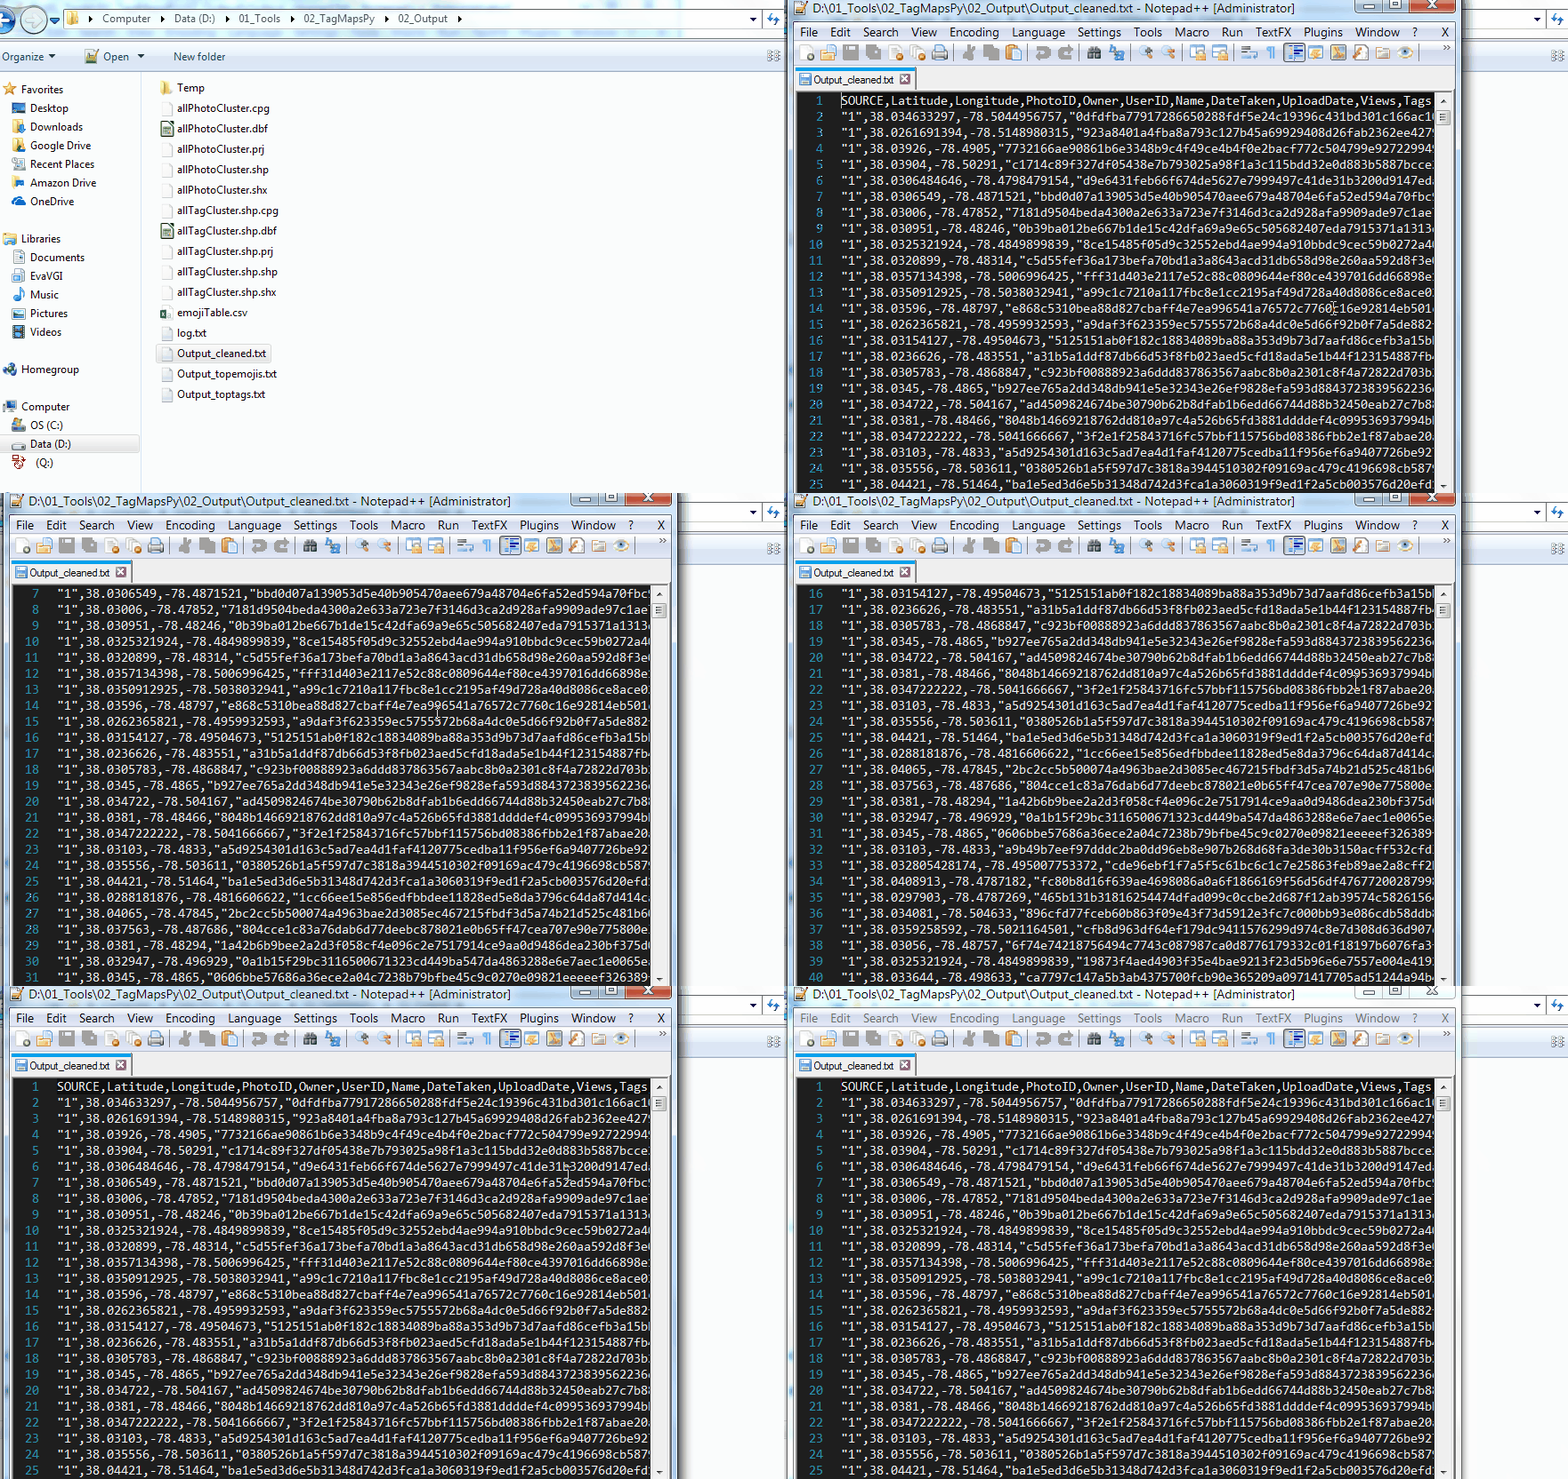
Output_cleaned.txt can be loaded into ArcGIS (CSV/Add XY-Data).
ArcMap
For the final visualization step (placing word-clouds on a map), ArcMap is needed. It is a future goal for tagmaps development to feature an independend label placement algorithm (e.g. for leaflet or mapbox).
Note
As of tagmaps 0.21.0, visualization with Mapnik is supported, as an alternative
to the visualization in ESRI ArcGIS.
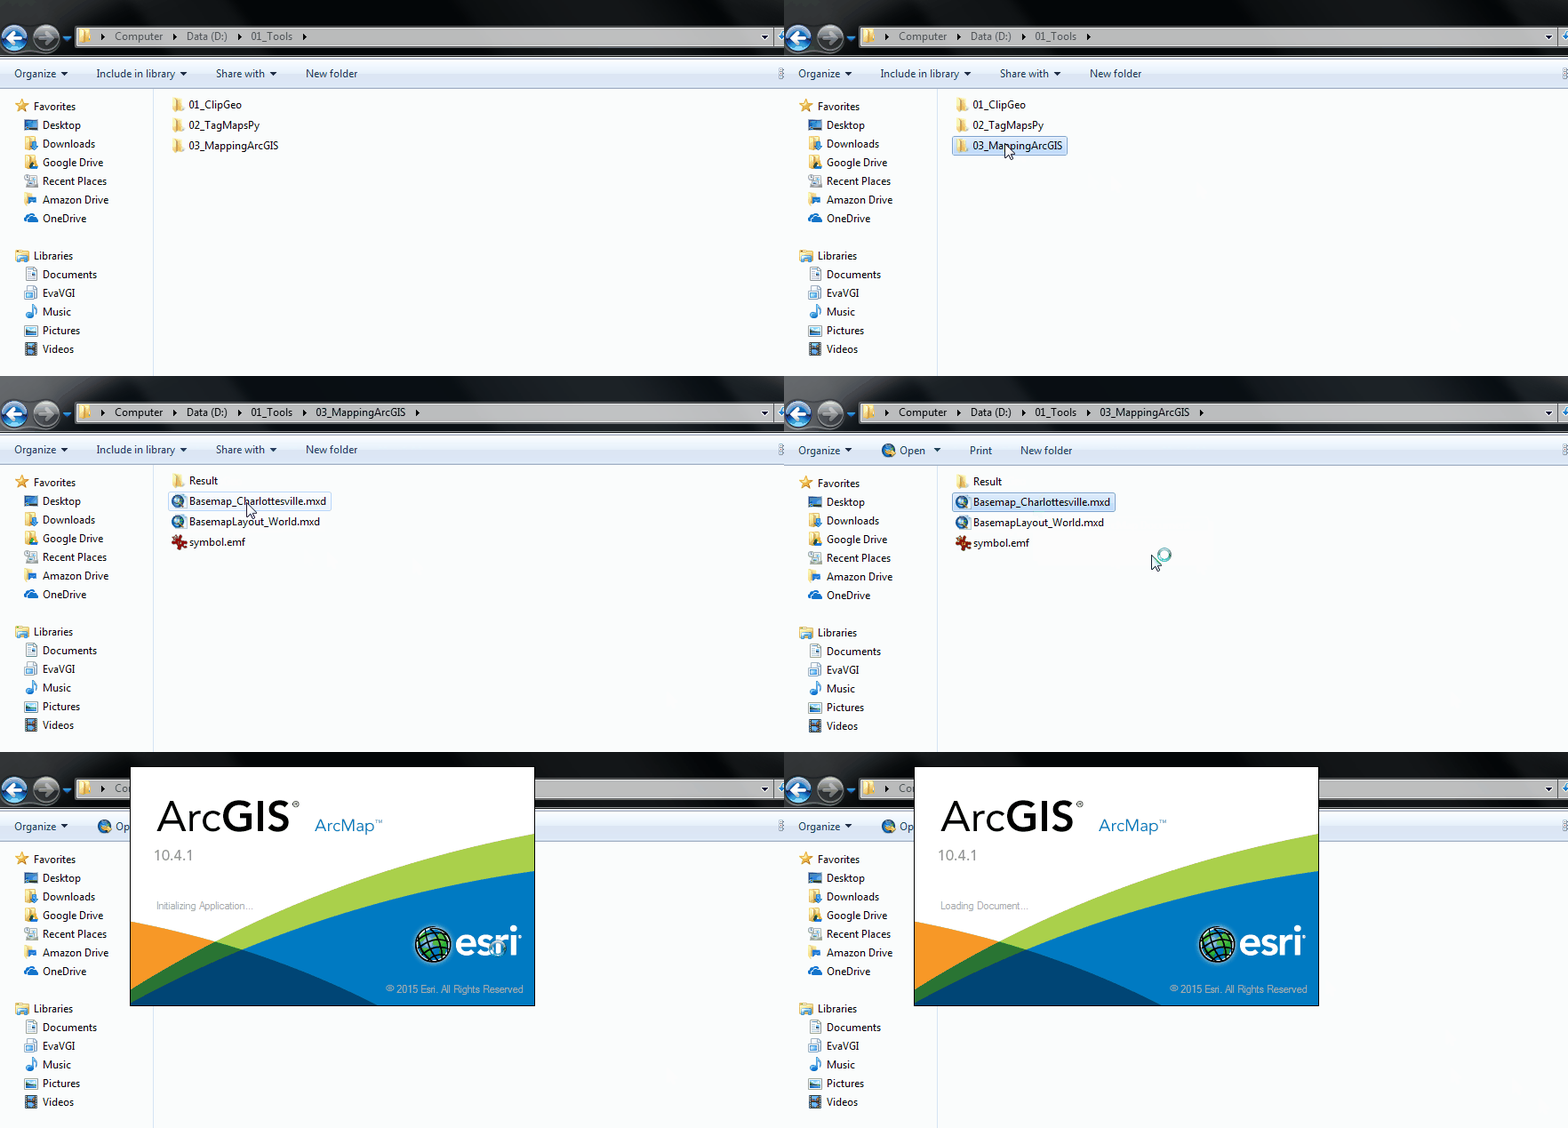
Open Basemap_World.mxd (available from resource folder).
This ArcMap document contains a pre-defined set of visualization rules for the shapefile-data created by Tag Maps.
For mapping Emoji, make sure you have a suitable font installed prior to opening ArcGIS. The font TwitterColorEmoji is used in the mxd and is available here.
Note
This is not necessary for Windows 10, since it has native Emoji support
Optional: fix broken links
Depending on your folder structure, you may see red "!", which means that links are missing. Fix those first:
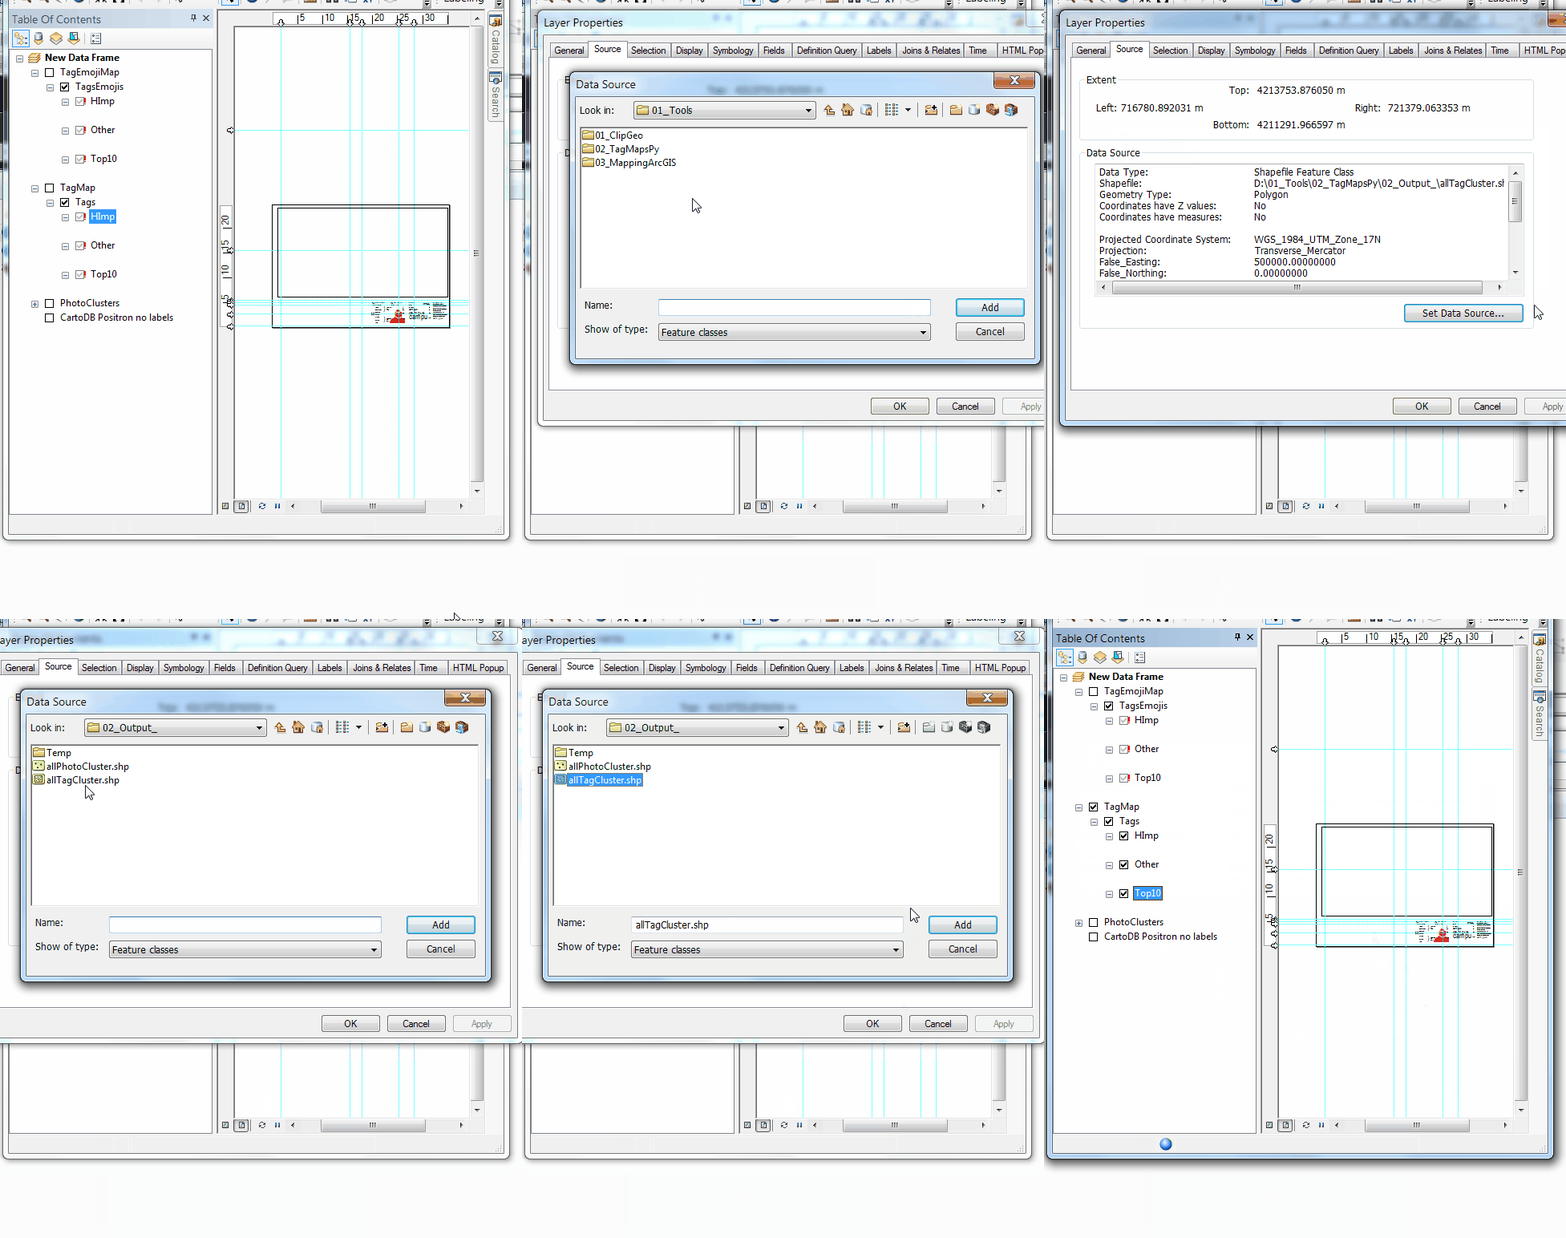
Note
Do not use Data > Repair Data source, since this will remove any visualization rules contained in data layers. Fixing links by Properties > Source > Set Data Source will leave any special layer settings untouched and simply repair the reference to underlying shape data.
Zoom to data extent
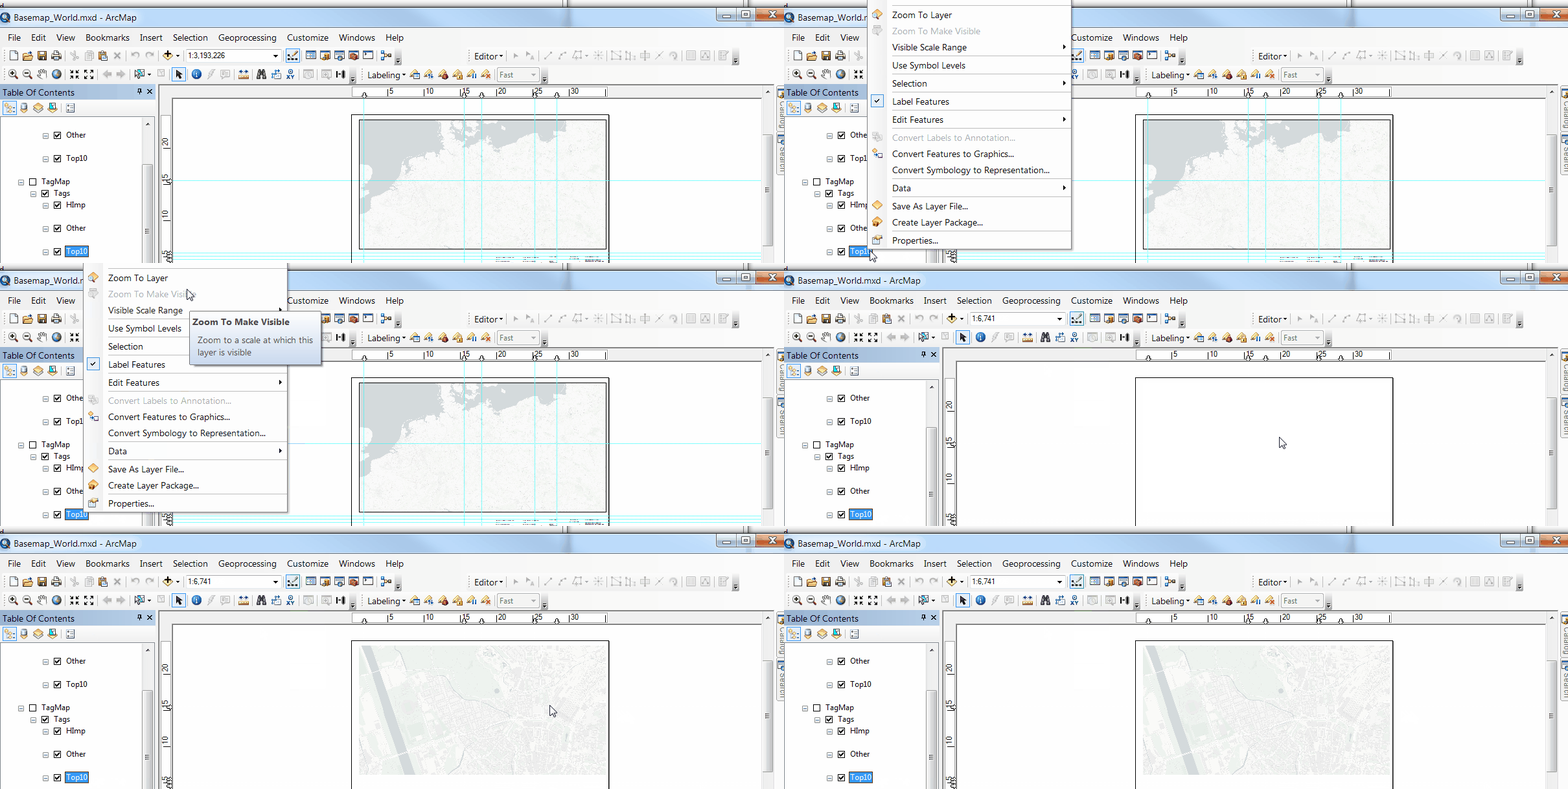
Zoom to area under investigation, based on the extent of our clustered shapefile.
Note
The use of ArcMap Layout View (instead of Data View) is by intent: Tag Maps are scale dependend. Therefore, the extent for which data has been clustered is fixed. If you wish to zoom in or out, you need to clip data prior to clustering and cluster again given the new extent. Using the layout view in ArcMap prevents accidentally zooming in or out.
All 3 Layers (e.g. Top10, Other, HImp) link to the same shapefile (allTagCluster.shp). Each layer has different queries defined, so that different classes of data can be visualized slightly different,
e.g. Top10Layer:
"Weights" >= 300 AND "HImpTag" = 1
Update projection
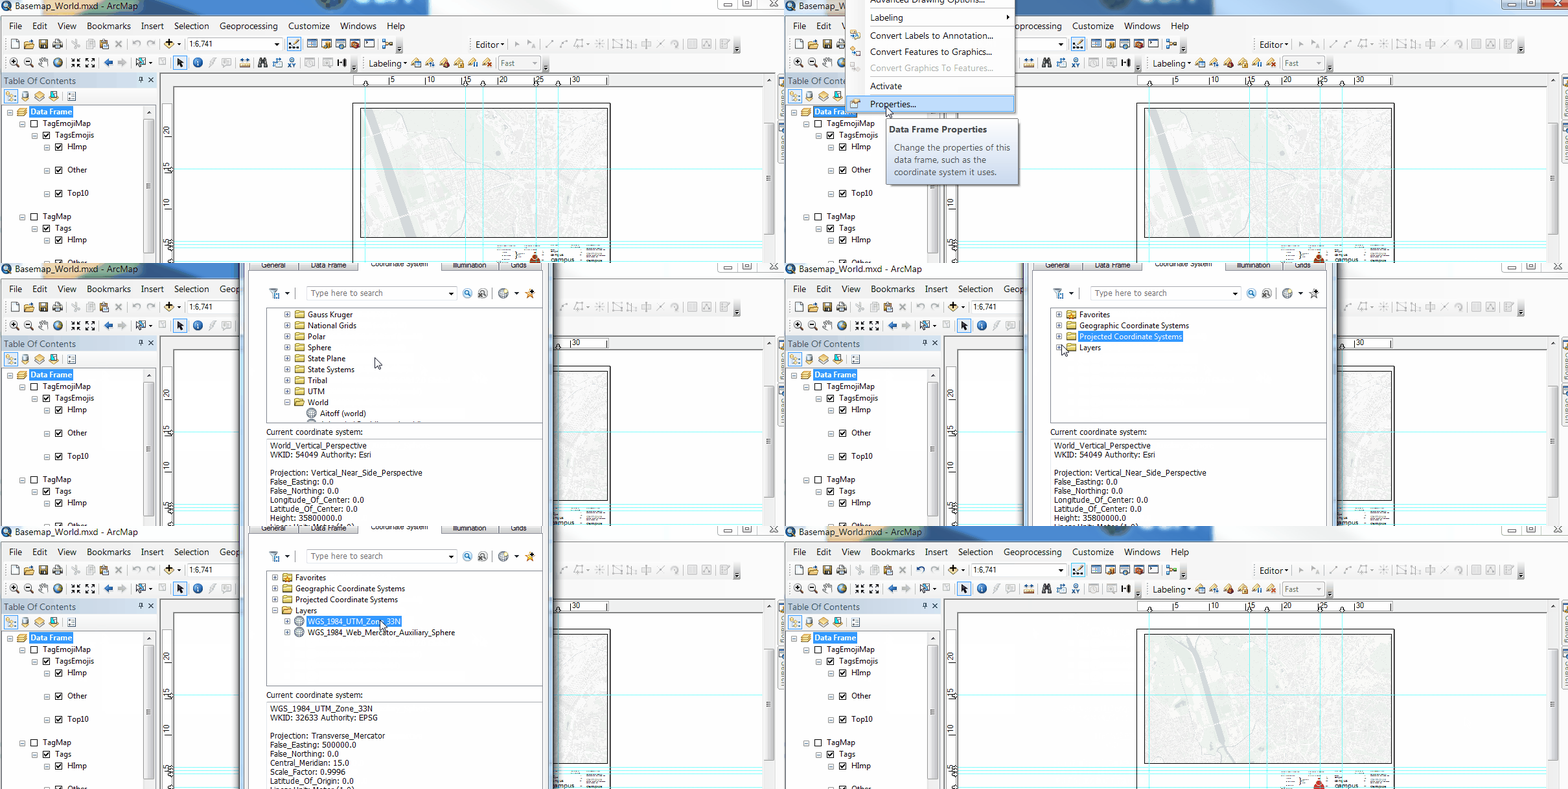
Set Data Frame Projection to the projection of clustered allTagCluster.shp
Original data is stored in WGS1984 Projection (Decimal Degrees, EPSG:4326). TagMapsPy will automatically select a suitable UTM Coordinate System and project data upon shapefile export.
Note
Matching both the Data Frame and the allTagCluster.shp Projections speeds up ArcGIS significantly.
Preview map
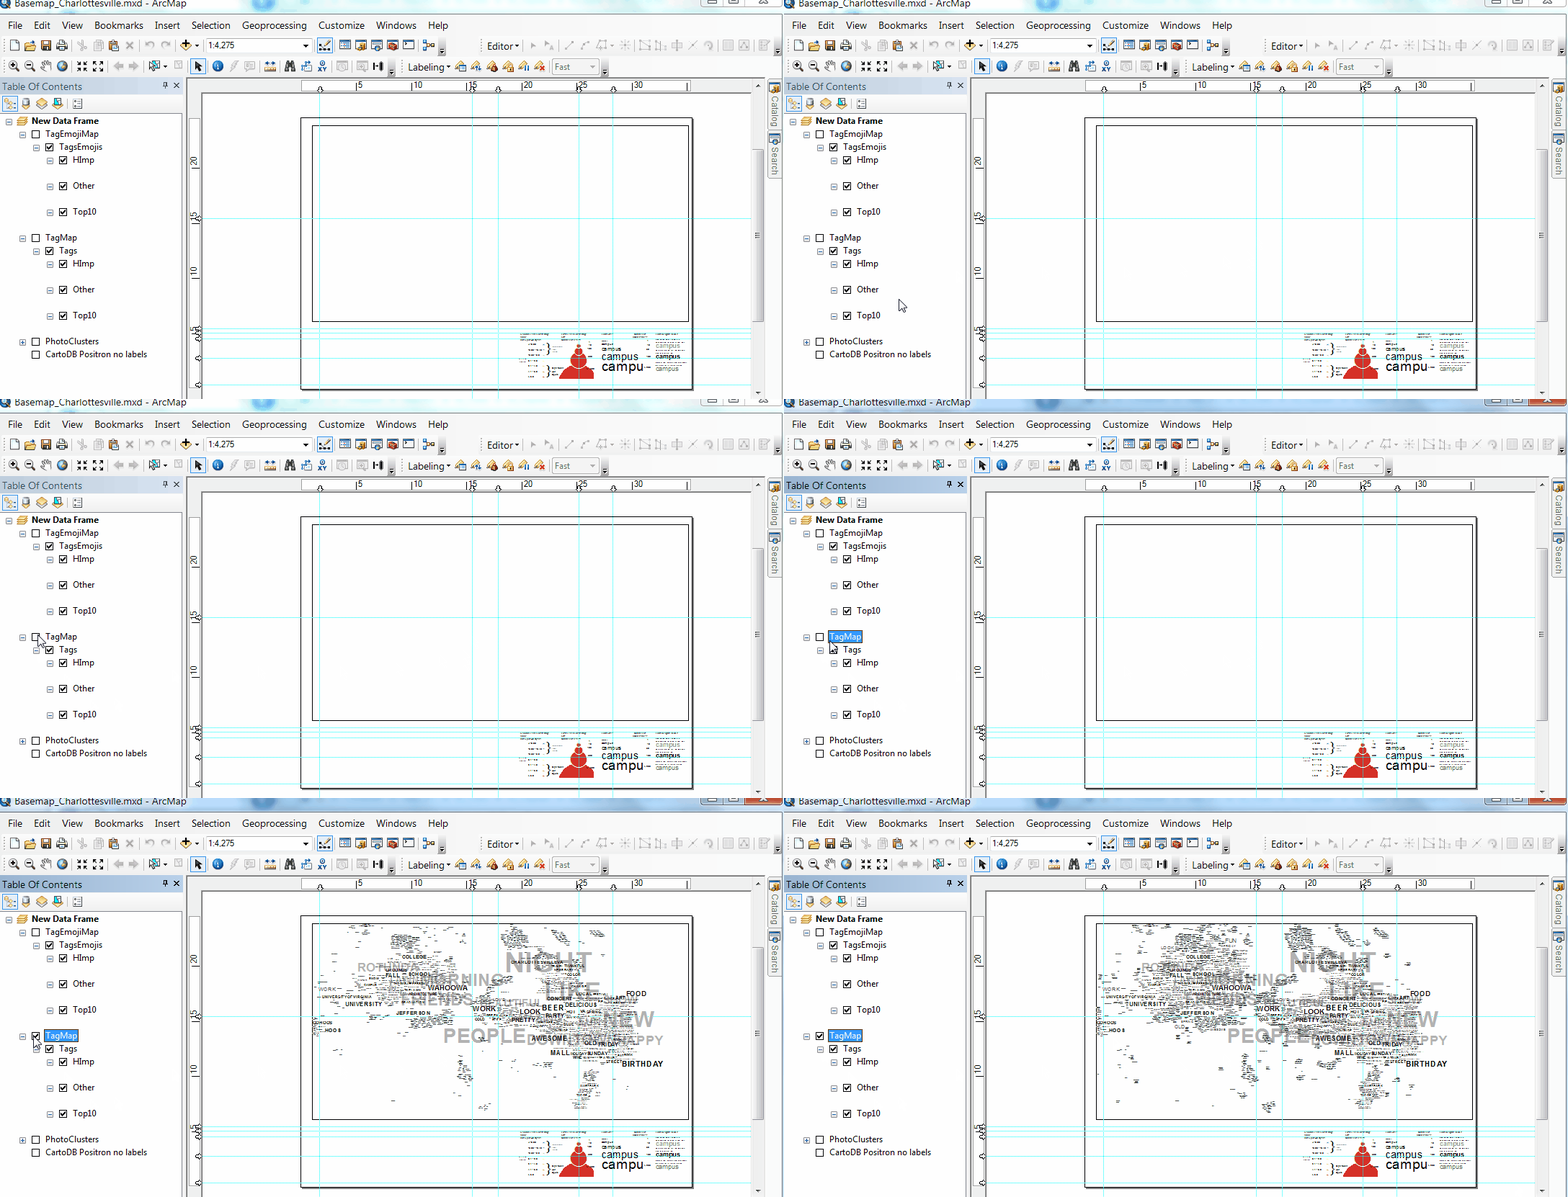
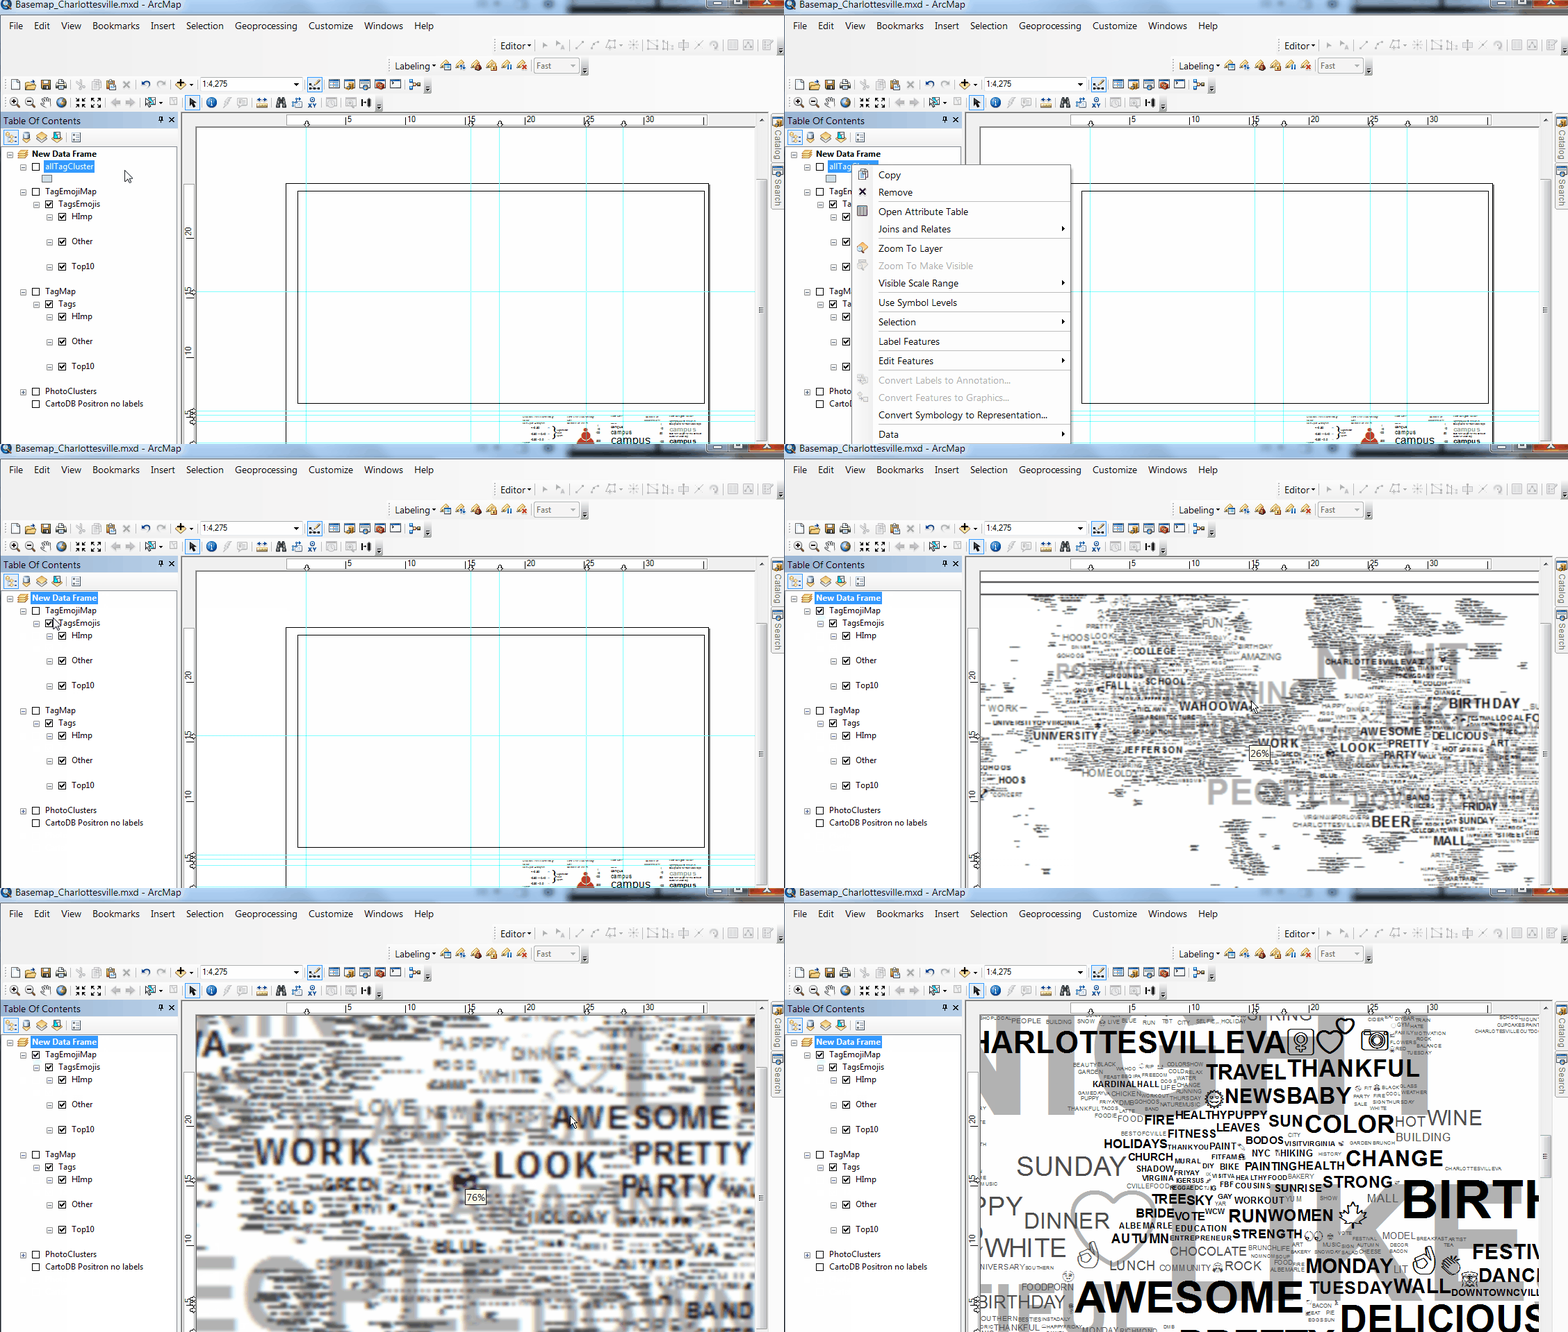
Enable the TagMap Layer-Group, Tags will draw.
Emoji clustering
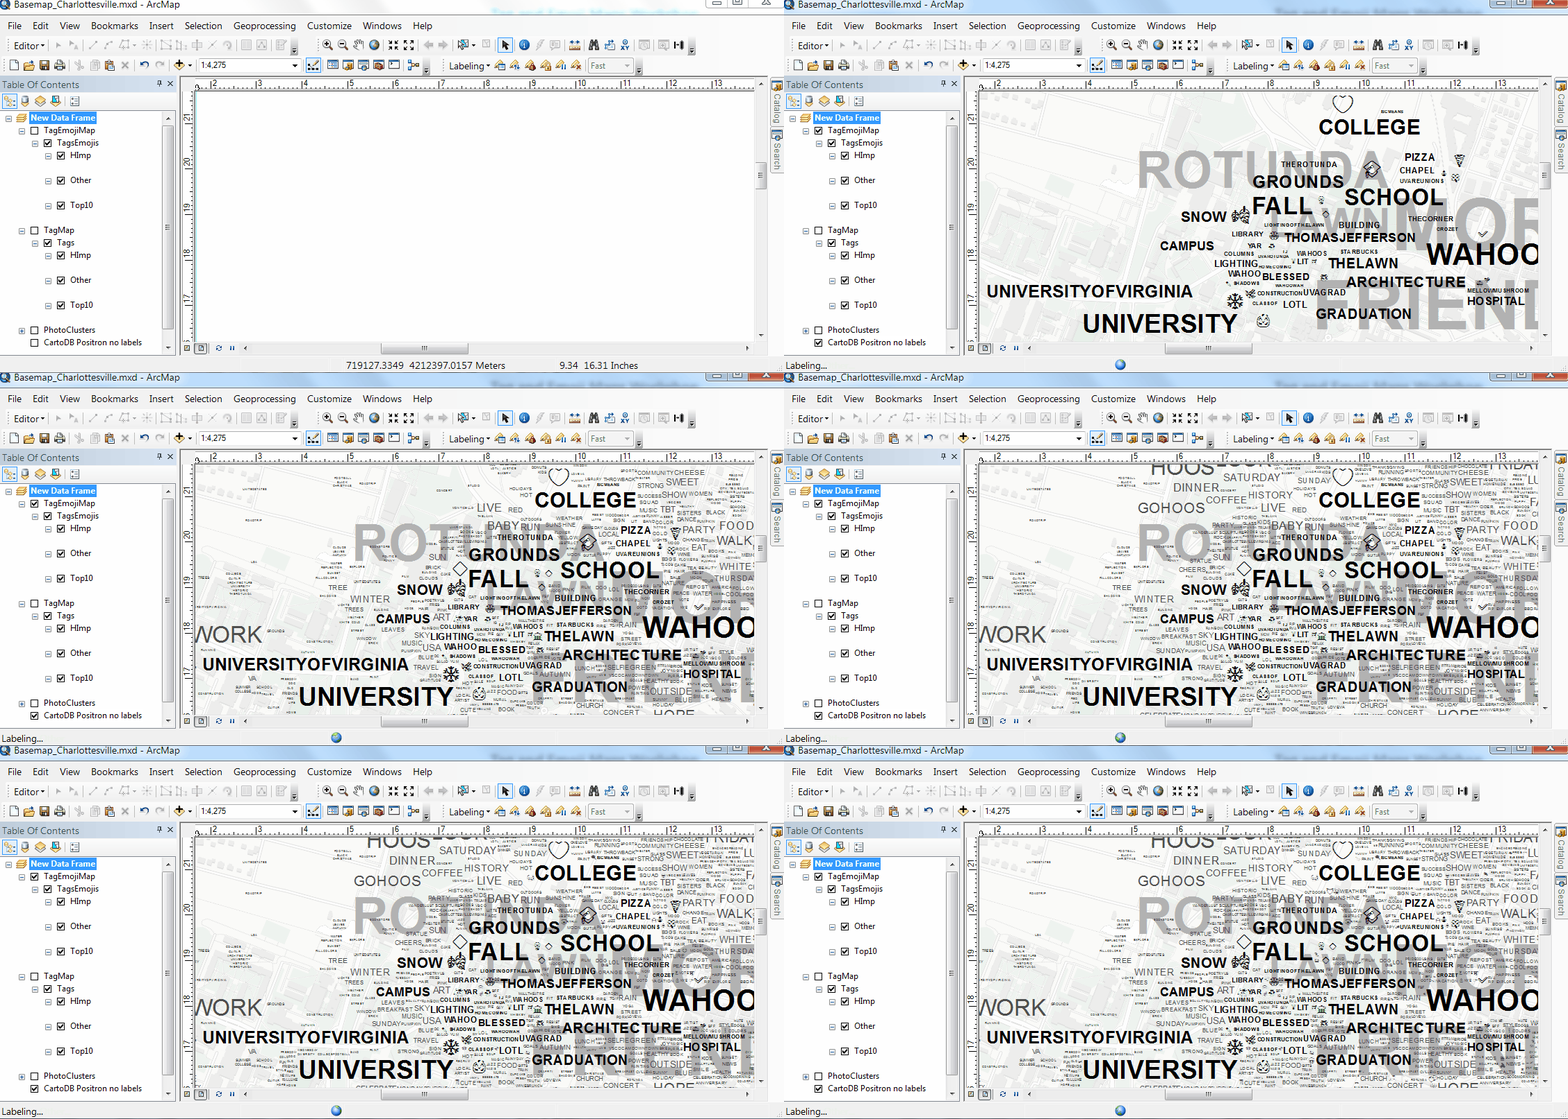
To view emoji-clustering, follow additional steps below.
There's a bug in Fiona/GDAL that currently prevents ArcGIS displaying Emoji-Unicode that is directly written to Shapefiles from Python.
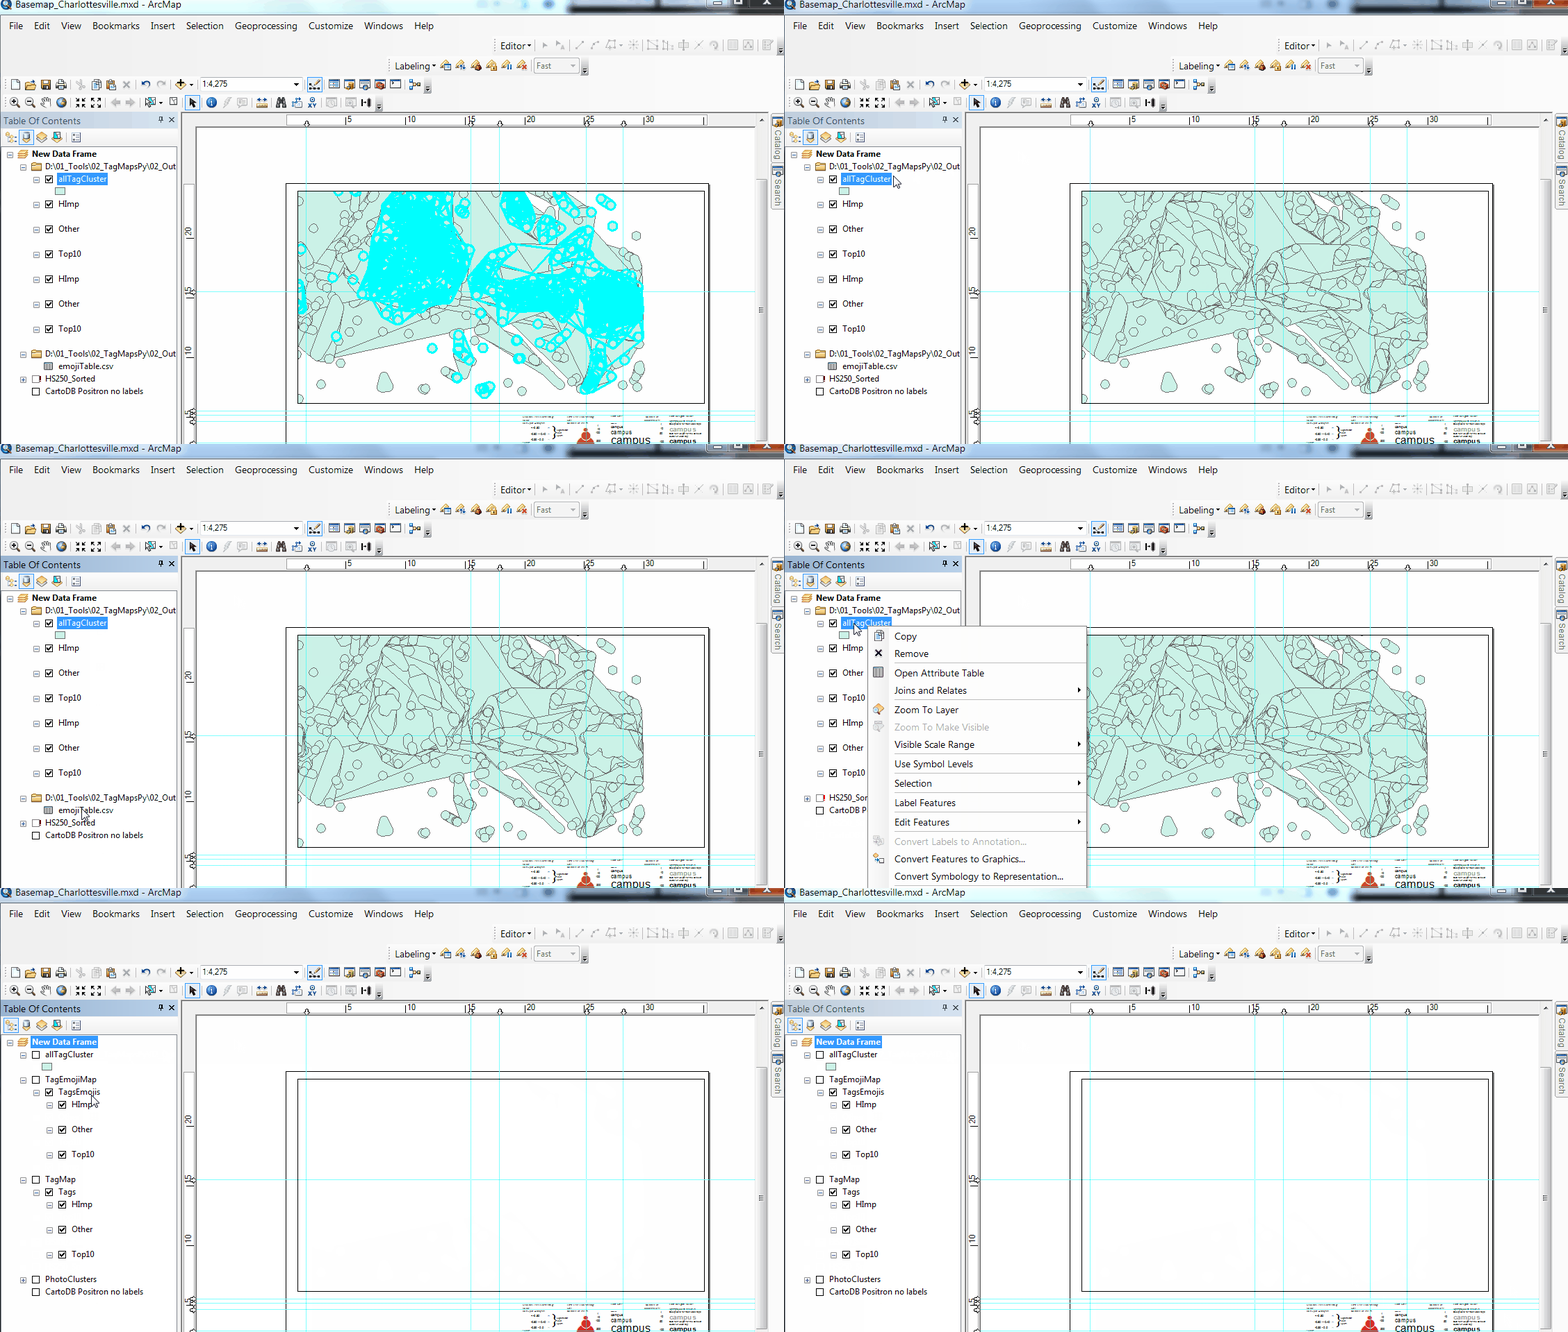
Until this bug is solved, you can import Emoji through CSV and Join to TagCluster Shapefile. Follow steps below..
For mapping Emoji, make sure you have a suitable font installed prior to opening ArcGIS. The font TwitterColorEmoji is used in the mxd and is available here.
(not necessary for Windows 10, which has native Emoji support)
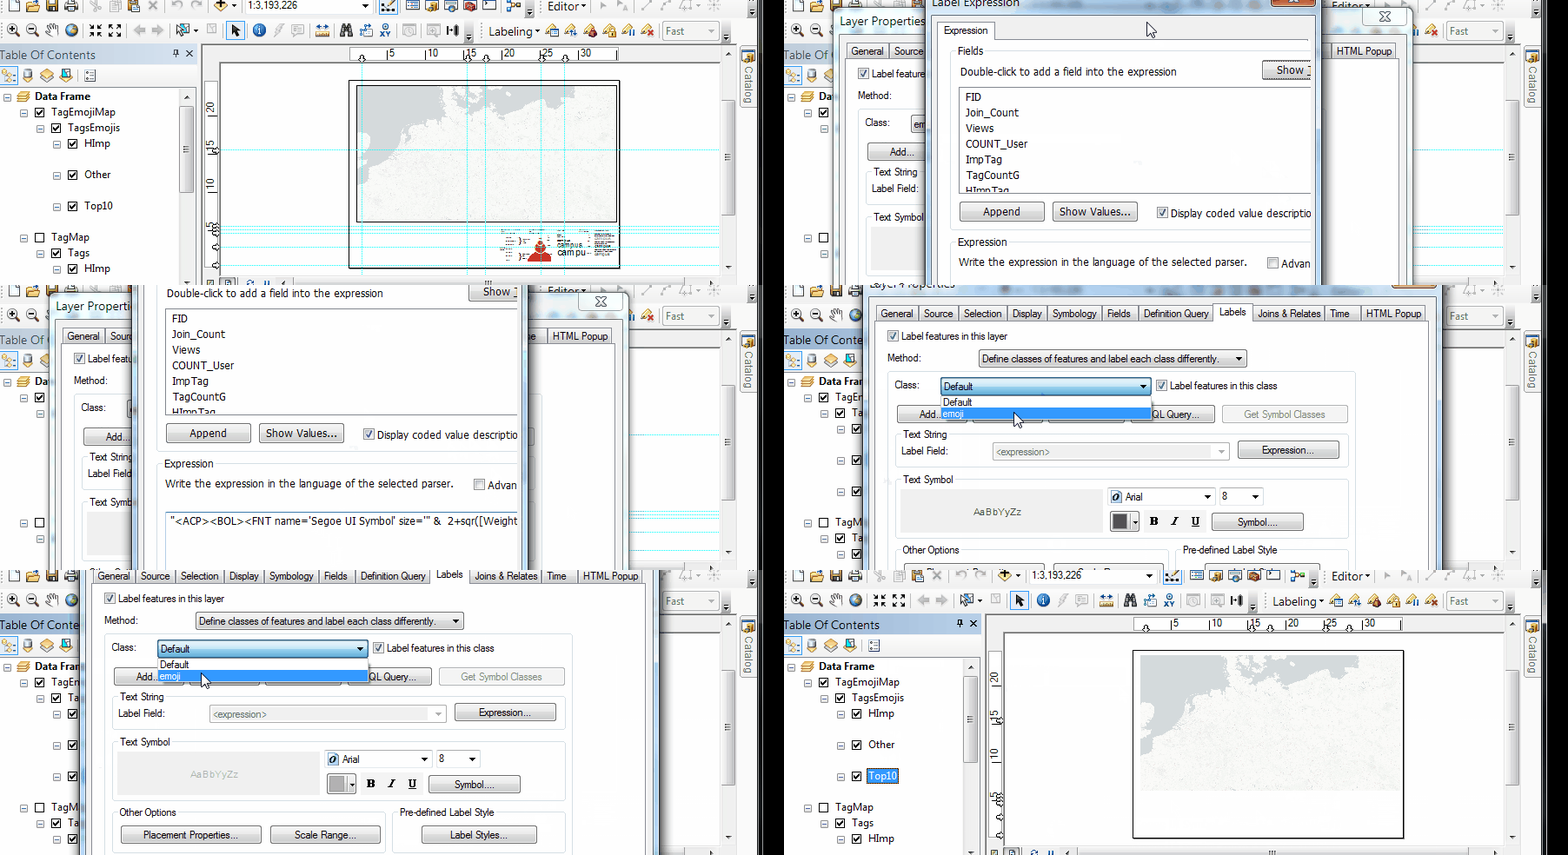
Alternatively, if TwitterColorEmoji is not available: replace font with "Segoe UI Symbol" in Windows 7 in all 3 layers (but: poor emoji coverage)
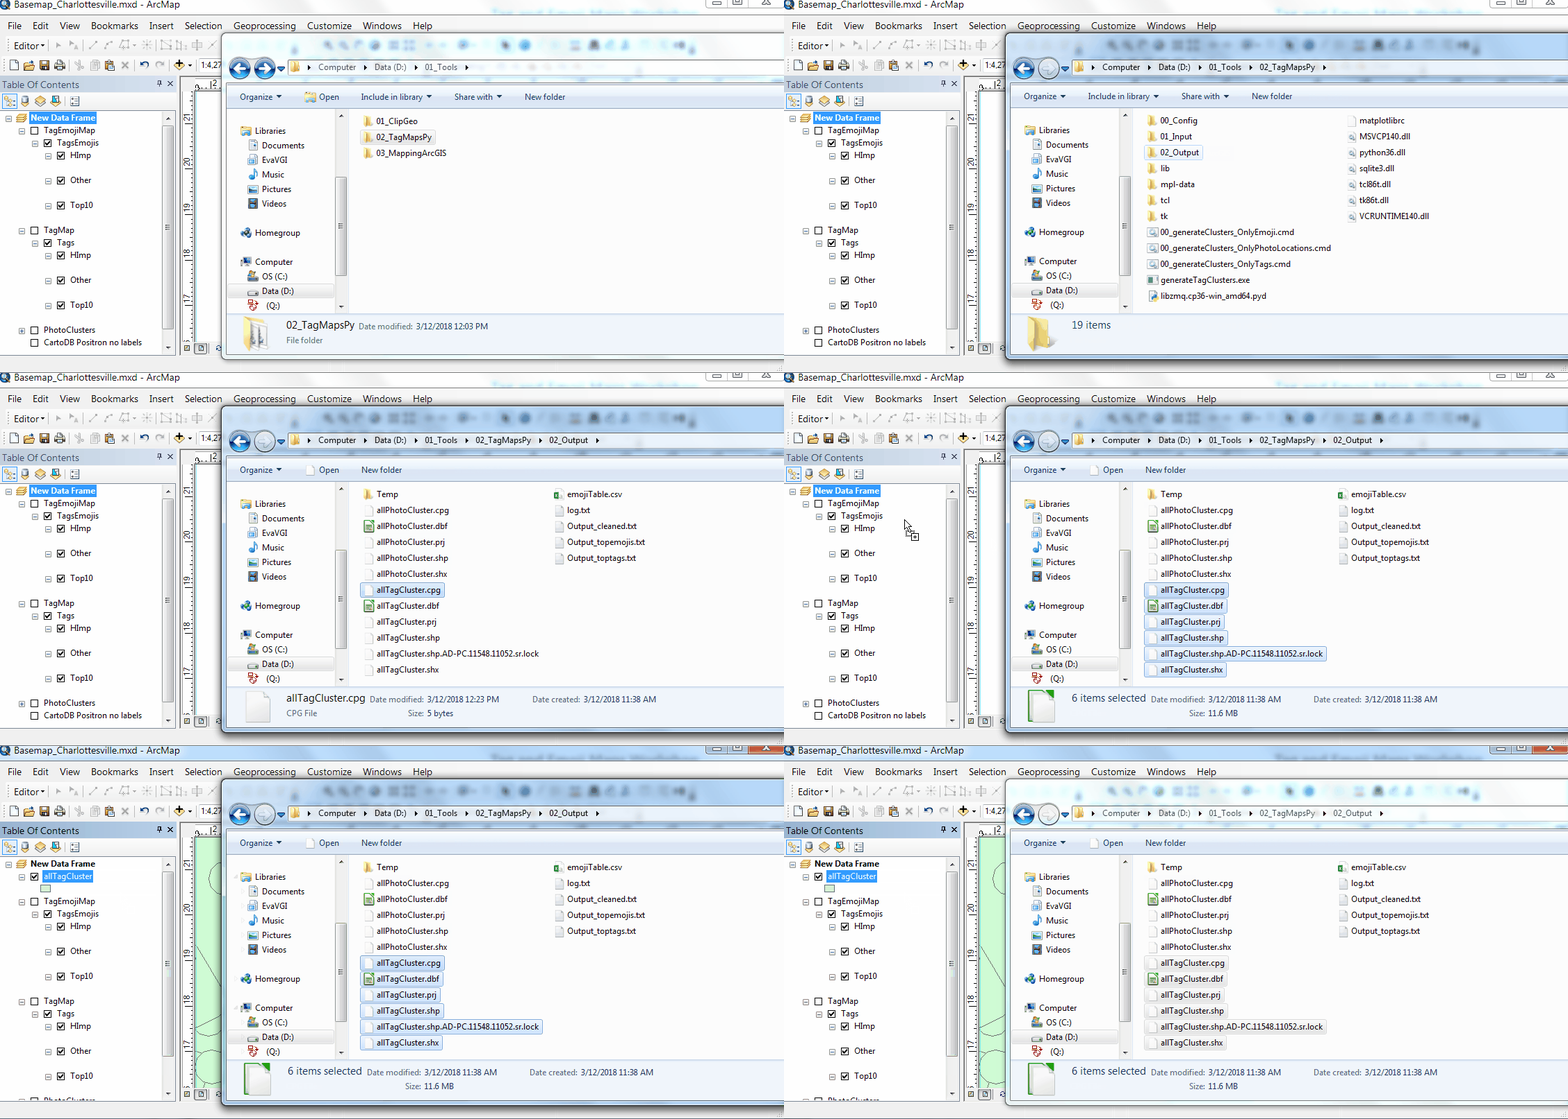
Add allTagCluster.shp to ArcGIS.
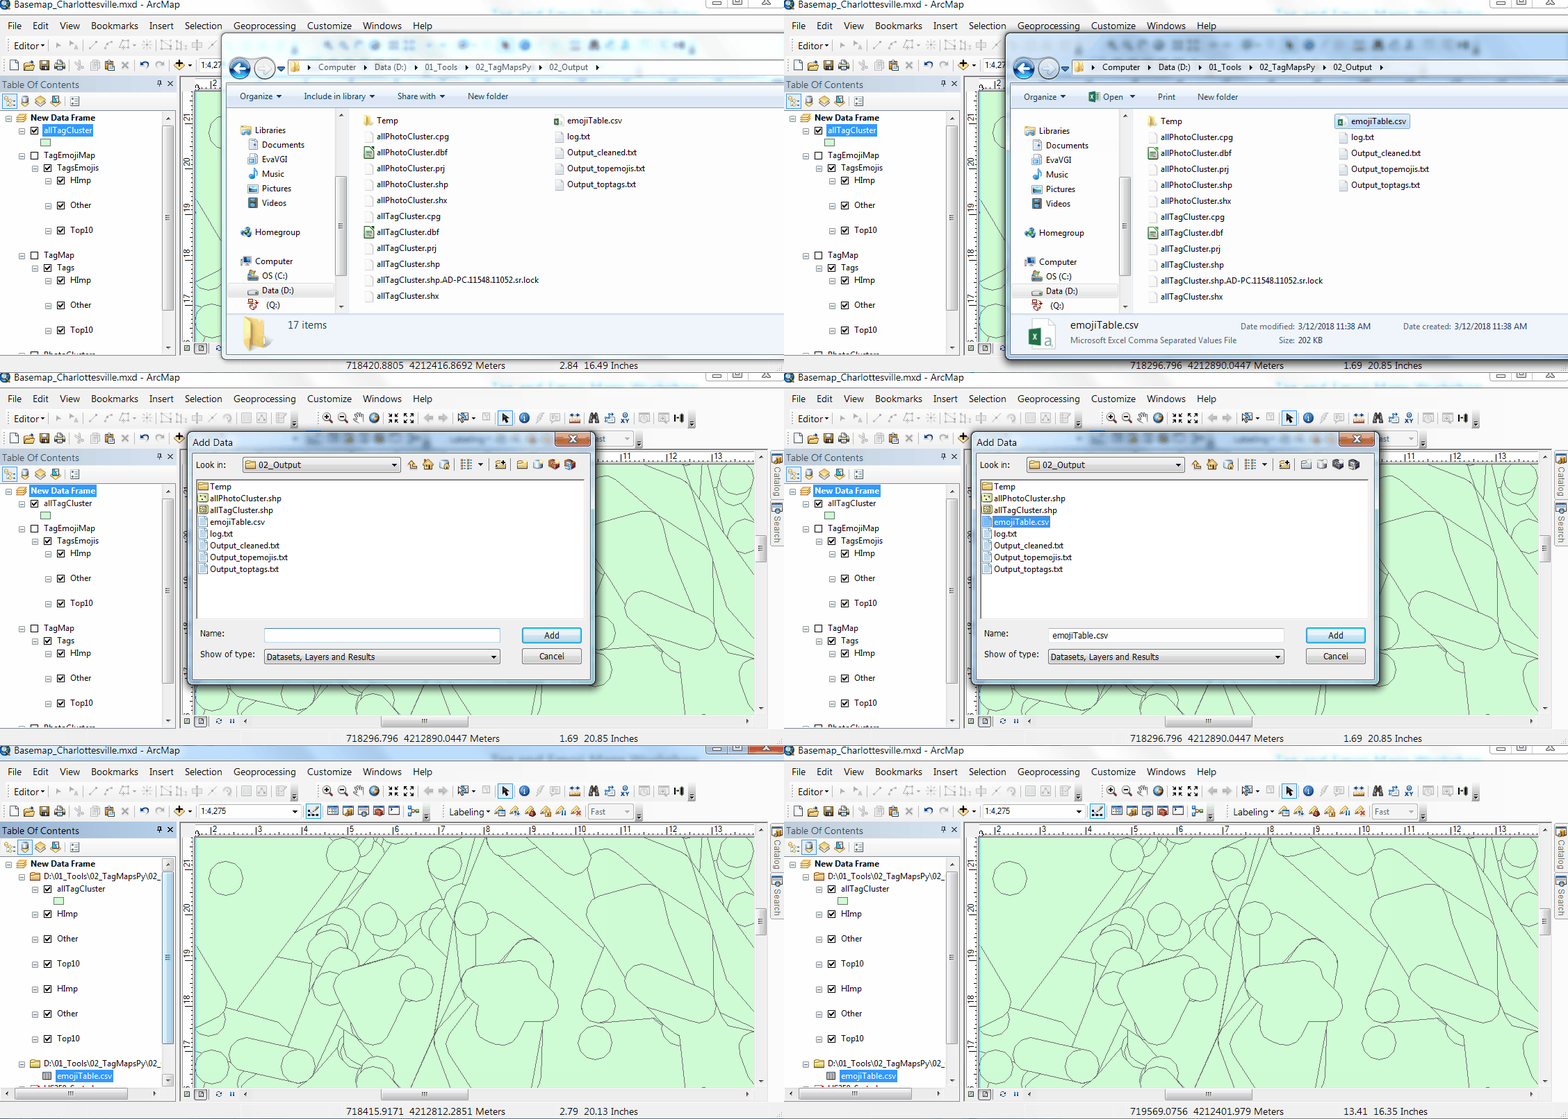
Add emojiTable.csv to ArcGIS.
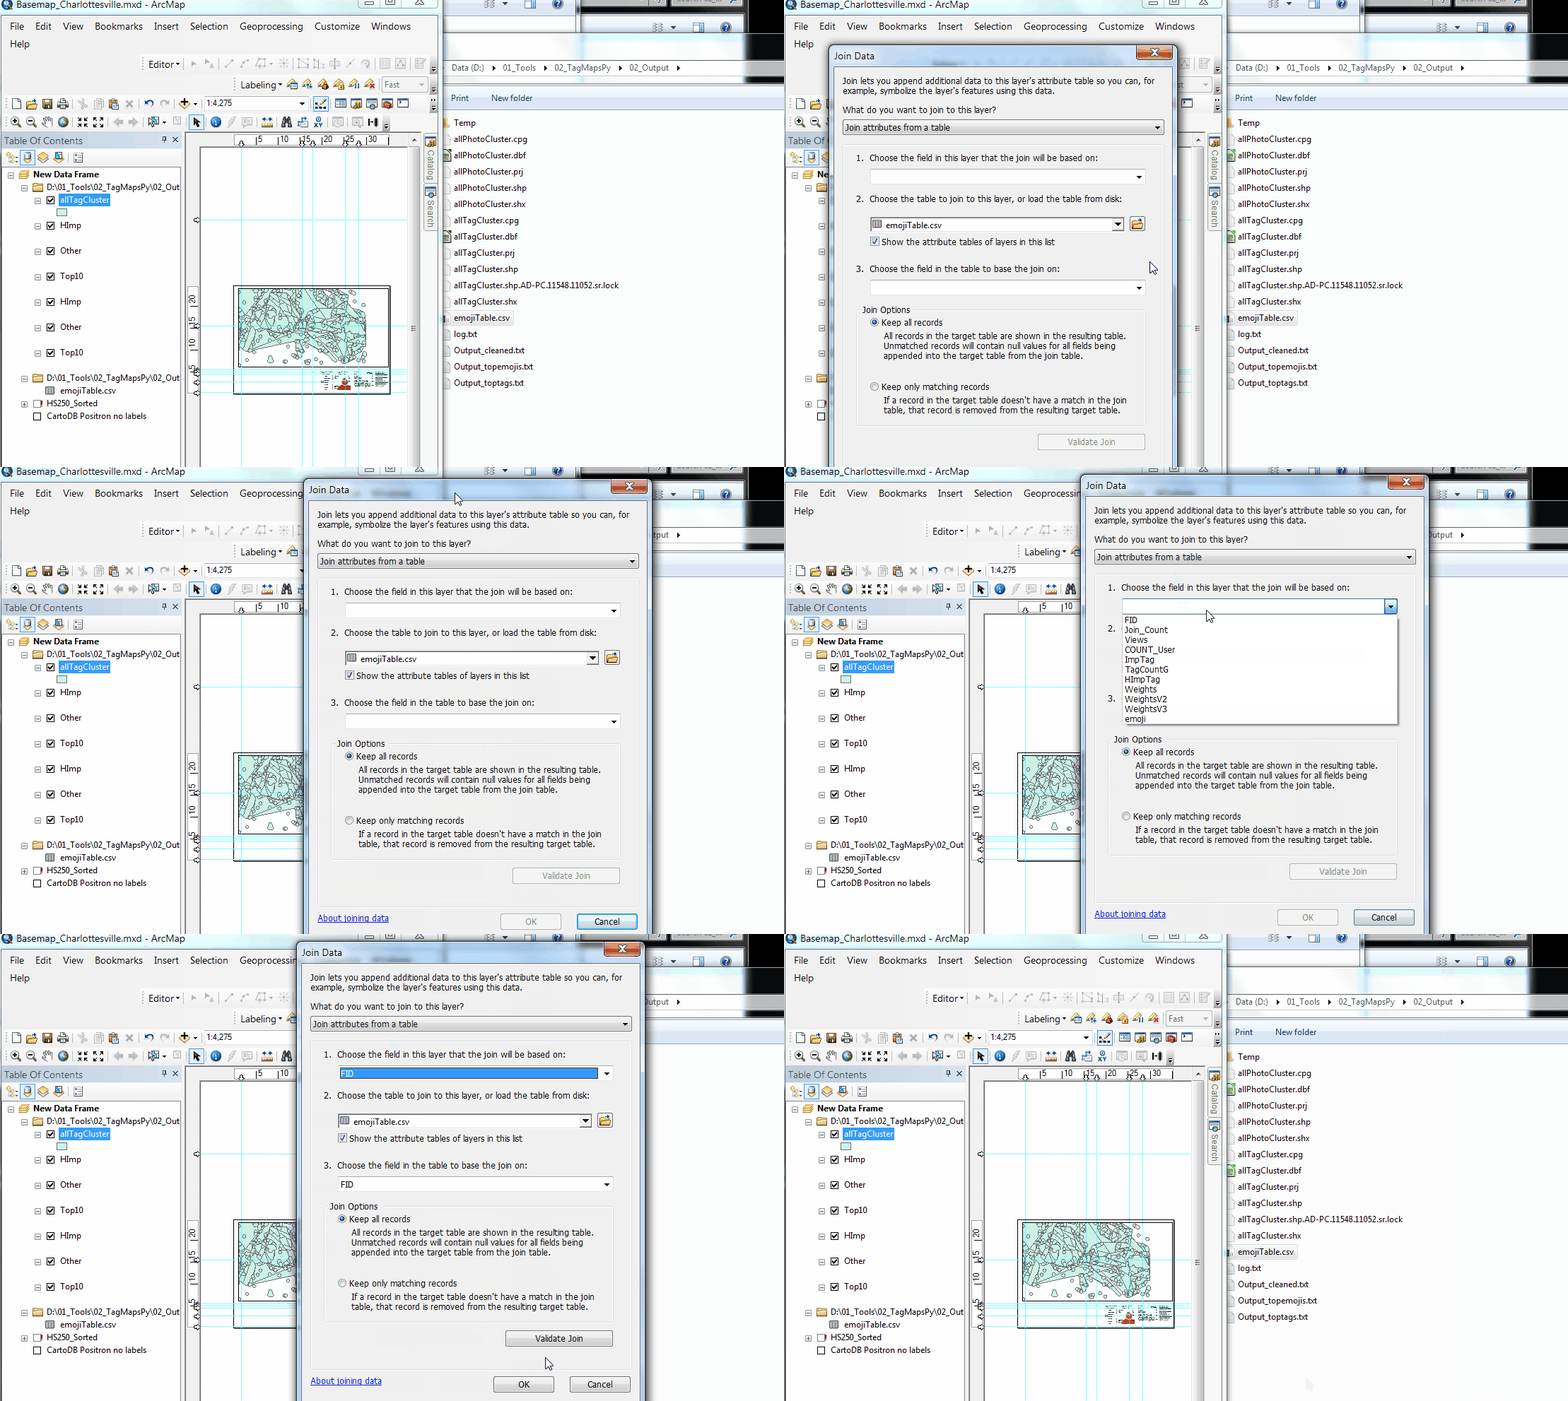
We'll now join the emojiTable.csv to the Tag Cluster Shapefile (based on FID)
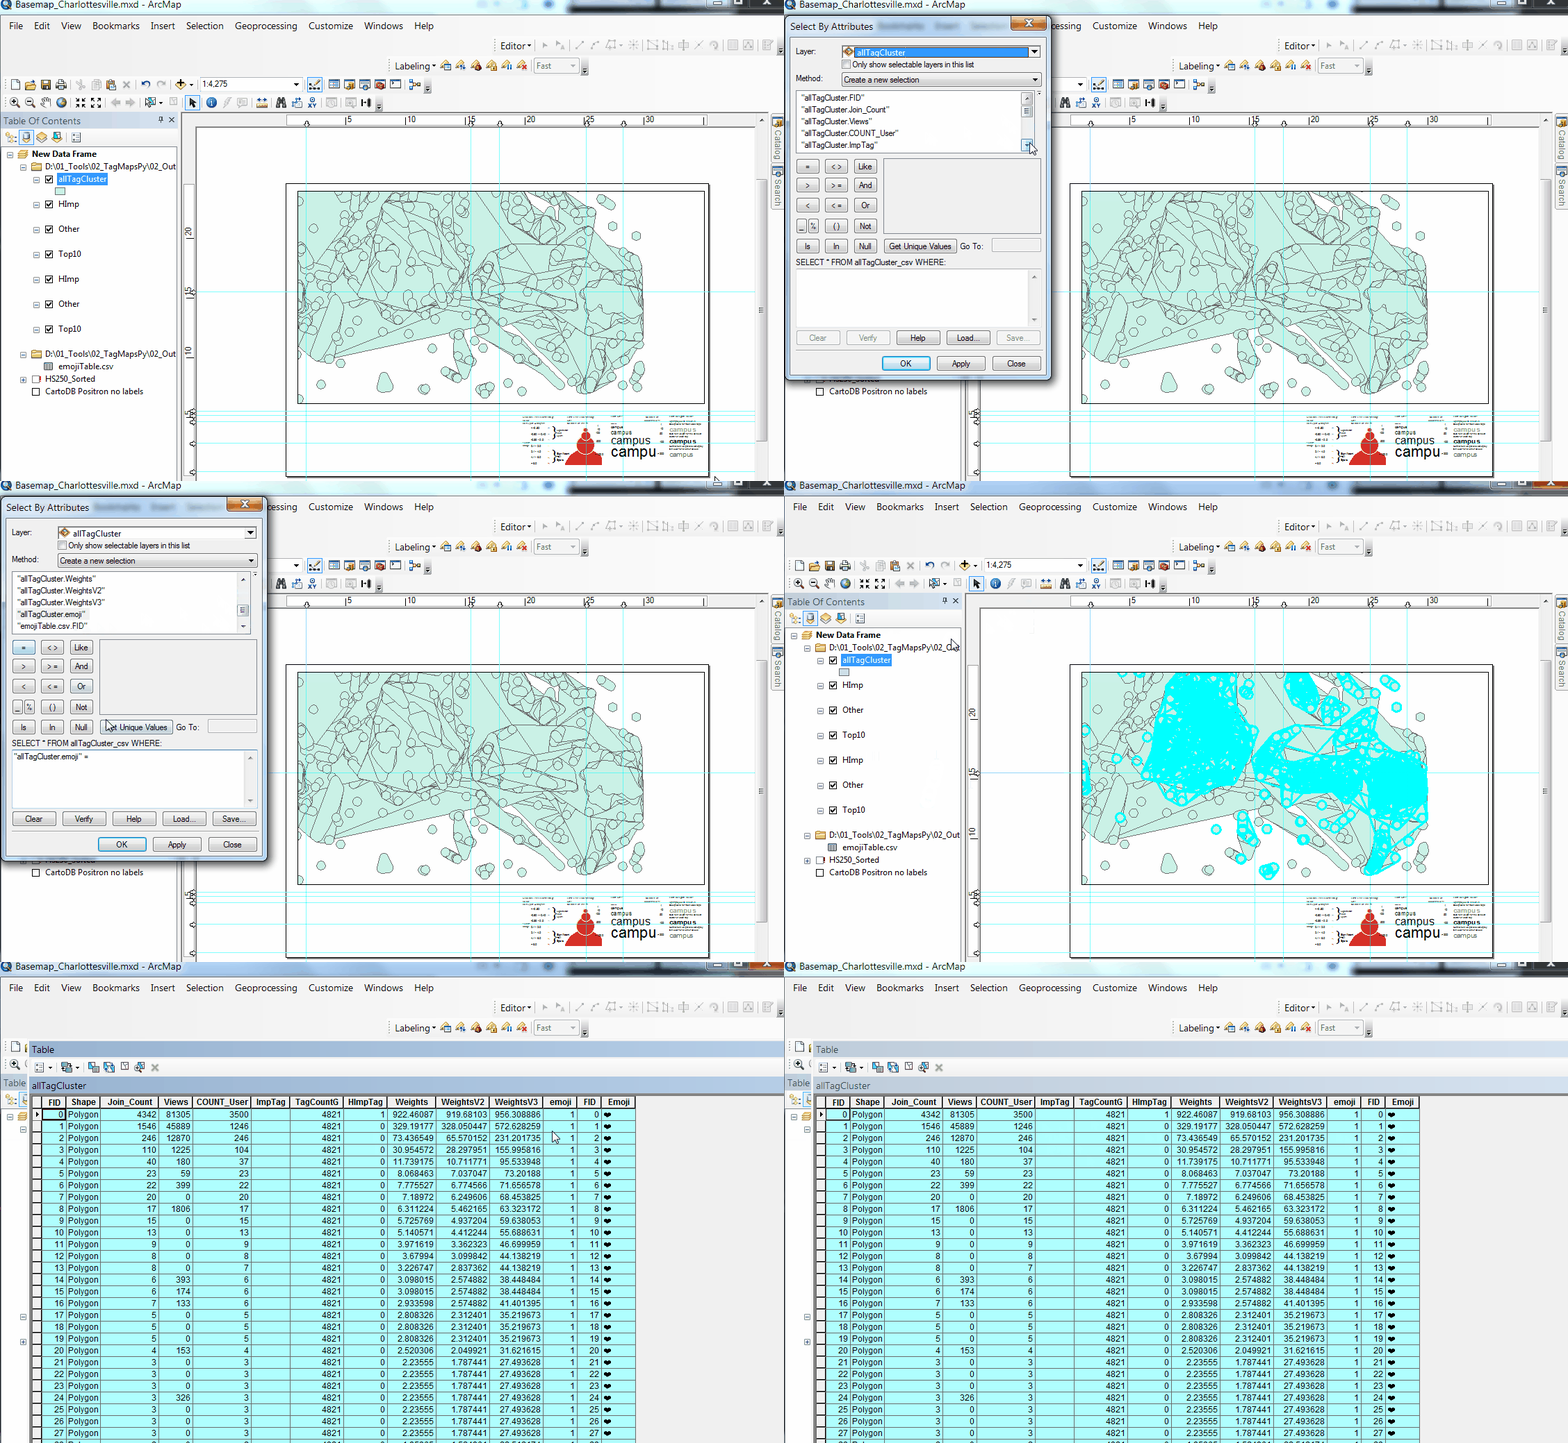
We'll now select all Clusters that are Emojis (Emoji-Column = 1)
Open Table and Copy Emojis from Join to Column "ImpTag"
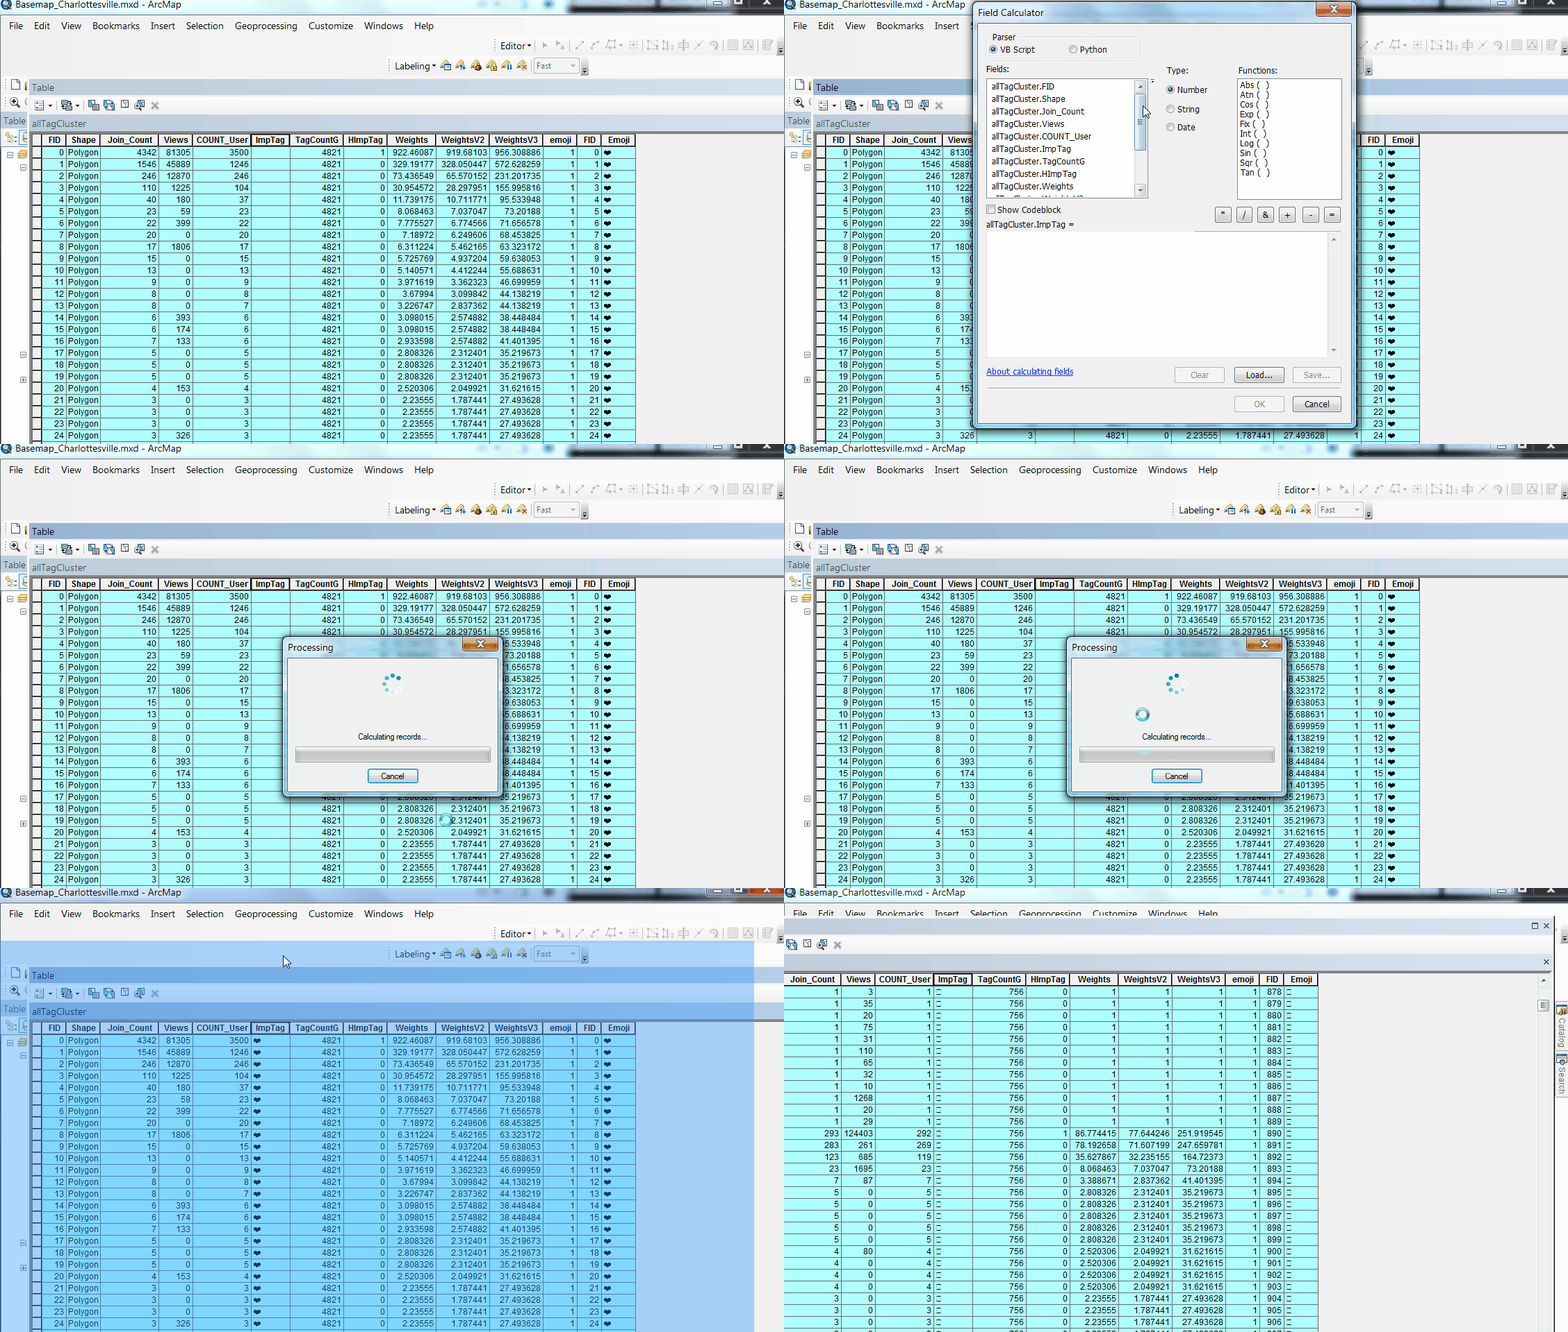
Remove Join and emojiTable.CSV
Enable Emoji Tag Map Layer
Location clustering
To add an additional layer showing overall location clustering,
follow steps below.
Visualizing post clusters (e.g. photo locations) in background helps assessing overall frequentation patterns.
The data for this layer is generated next to Tag Clusters and can be found in /Output/allLocationClusters.shp.
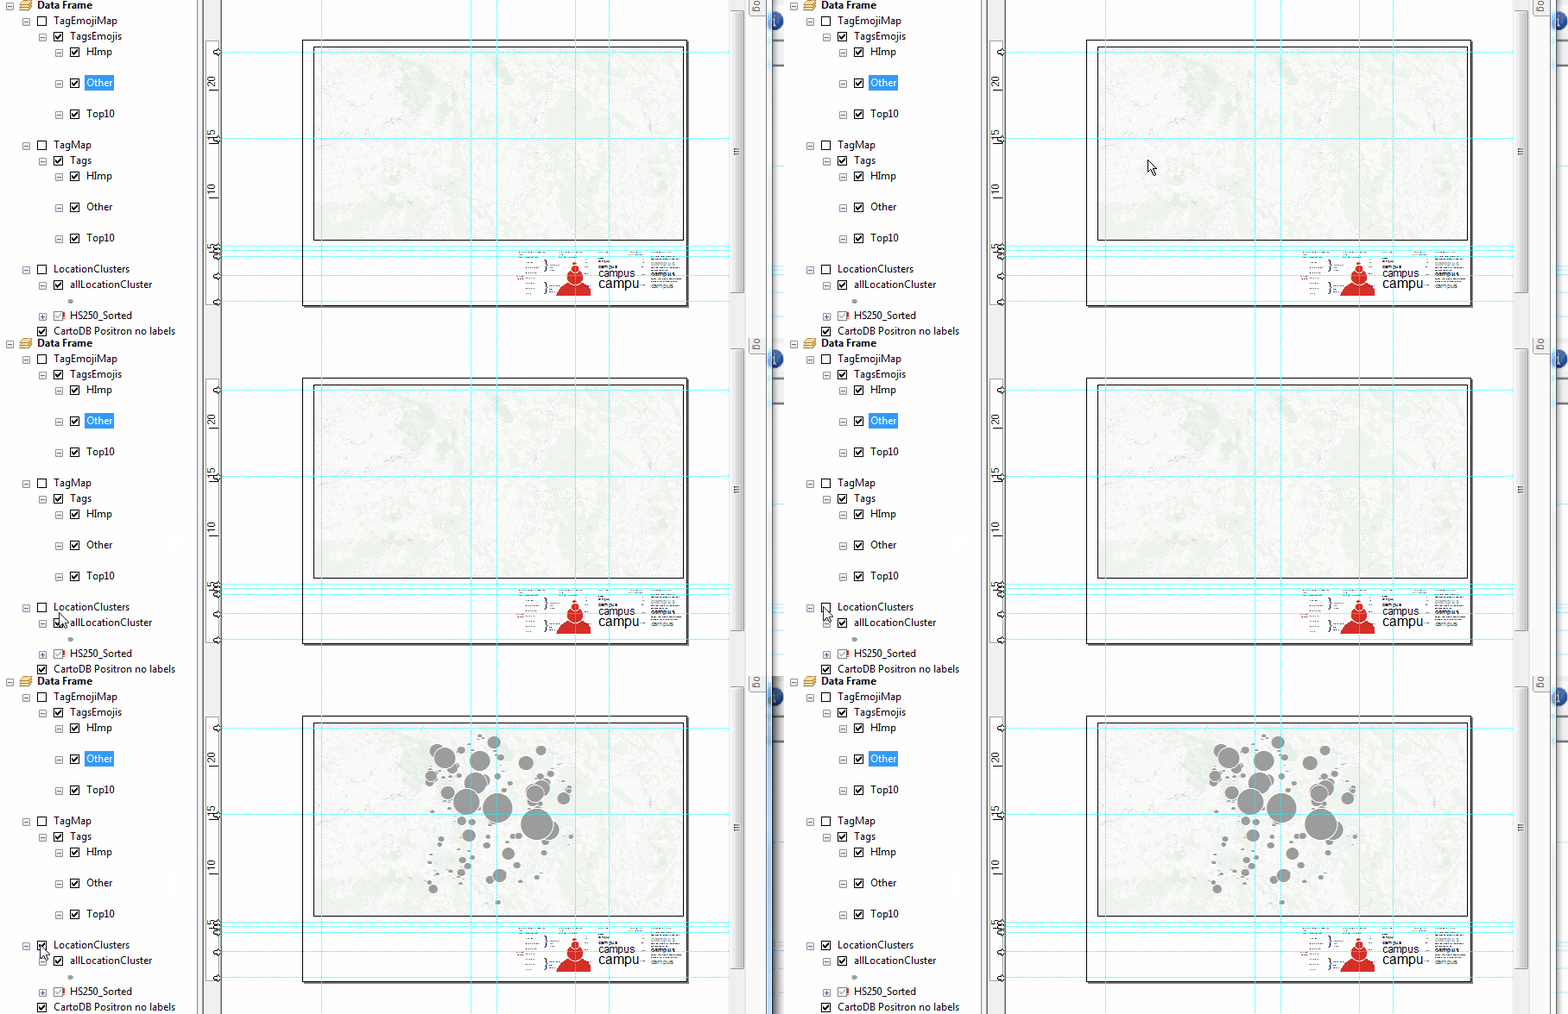
Enable Location Cluster Layer: shows base clustering.
We'll analyze the patterns of photo clustering using the Getis-Ord Gi* Statistic that is available in Spatial Analyst Extension. This is used to colorize clusters in hot and cold spots.
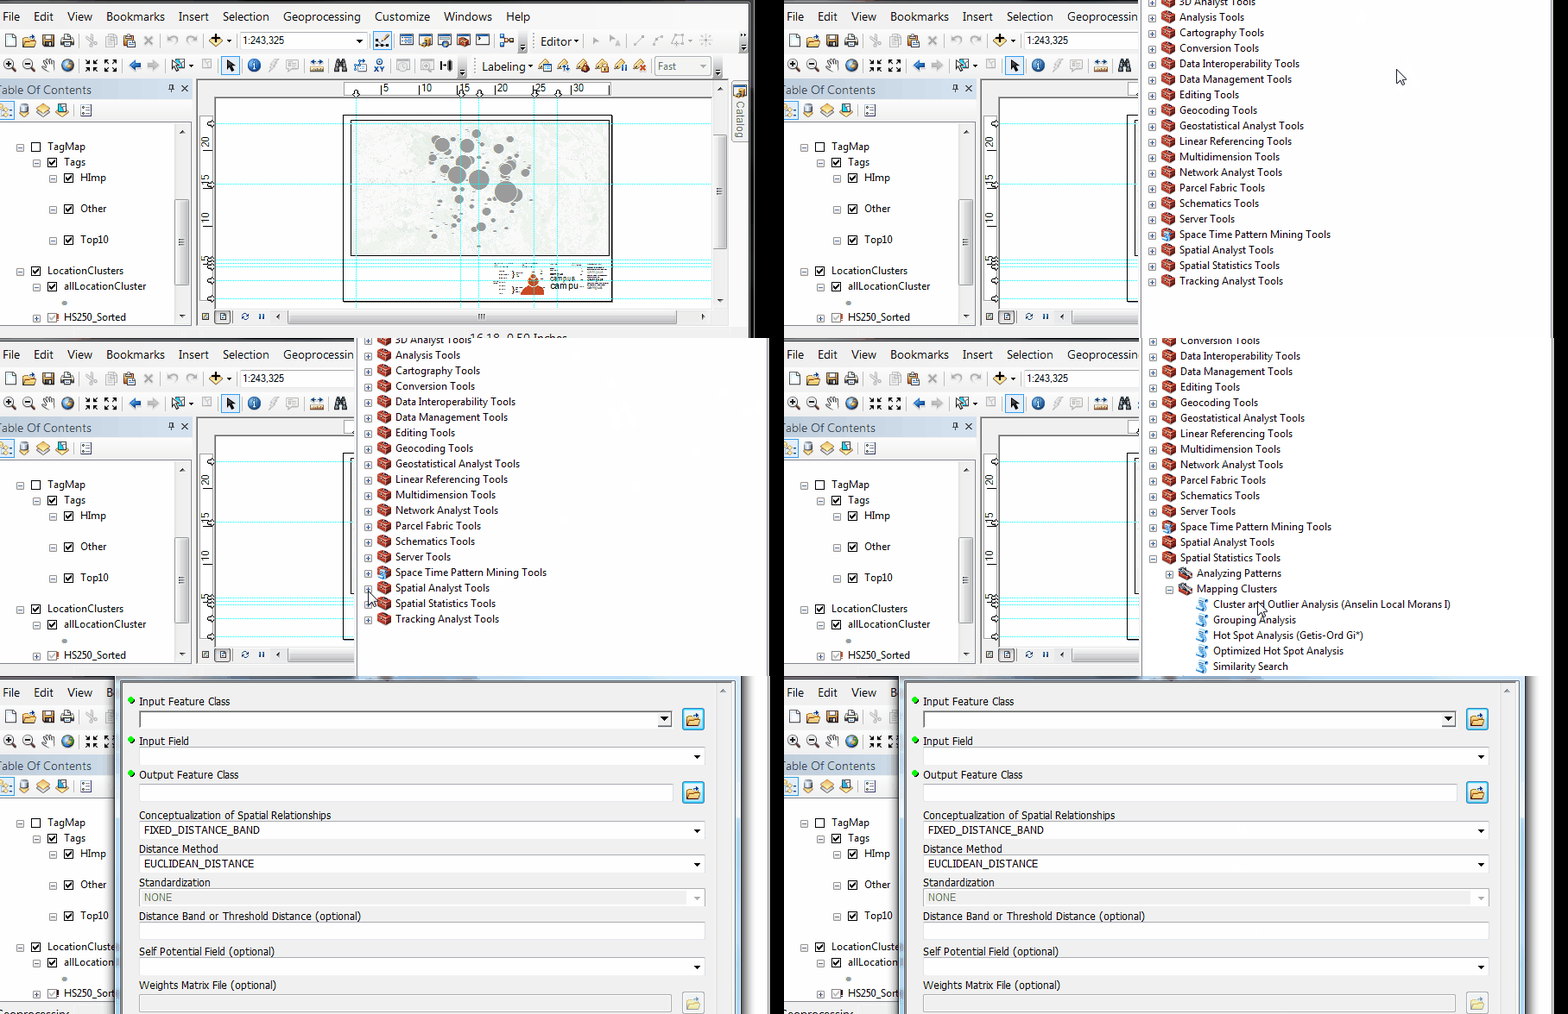
Find the tool under Spatial Analyst/Mapping Clusters.
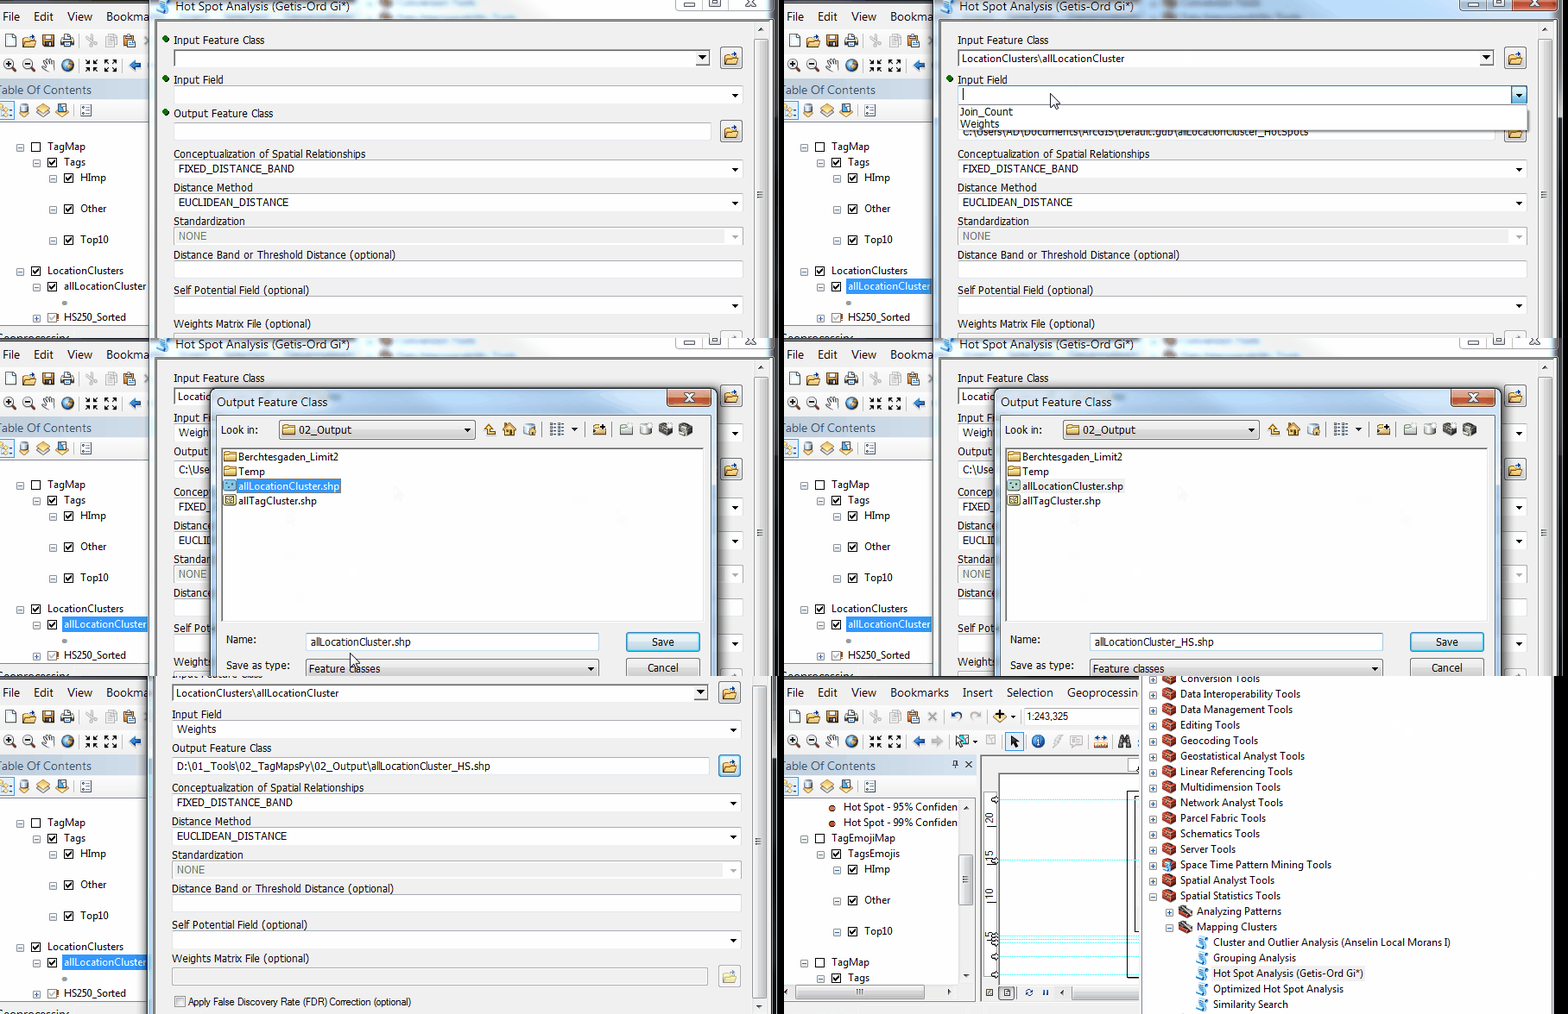
Add Location Clusters, select Weights field, specify output location, and click OK
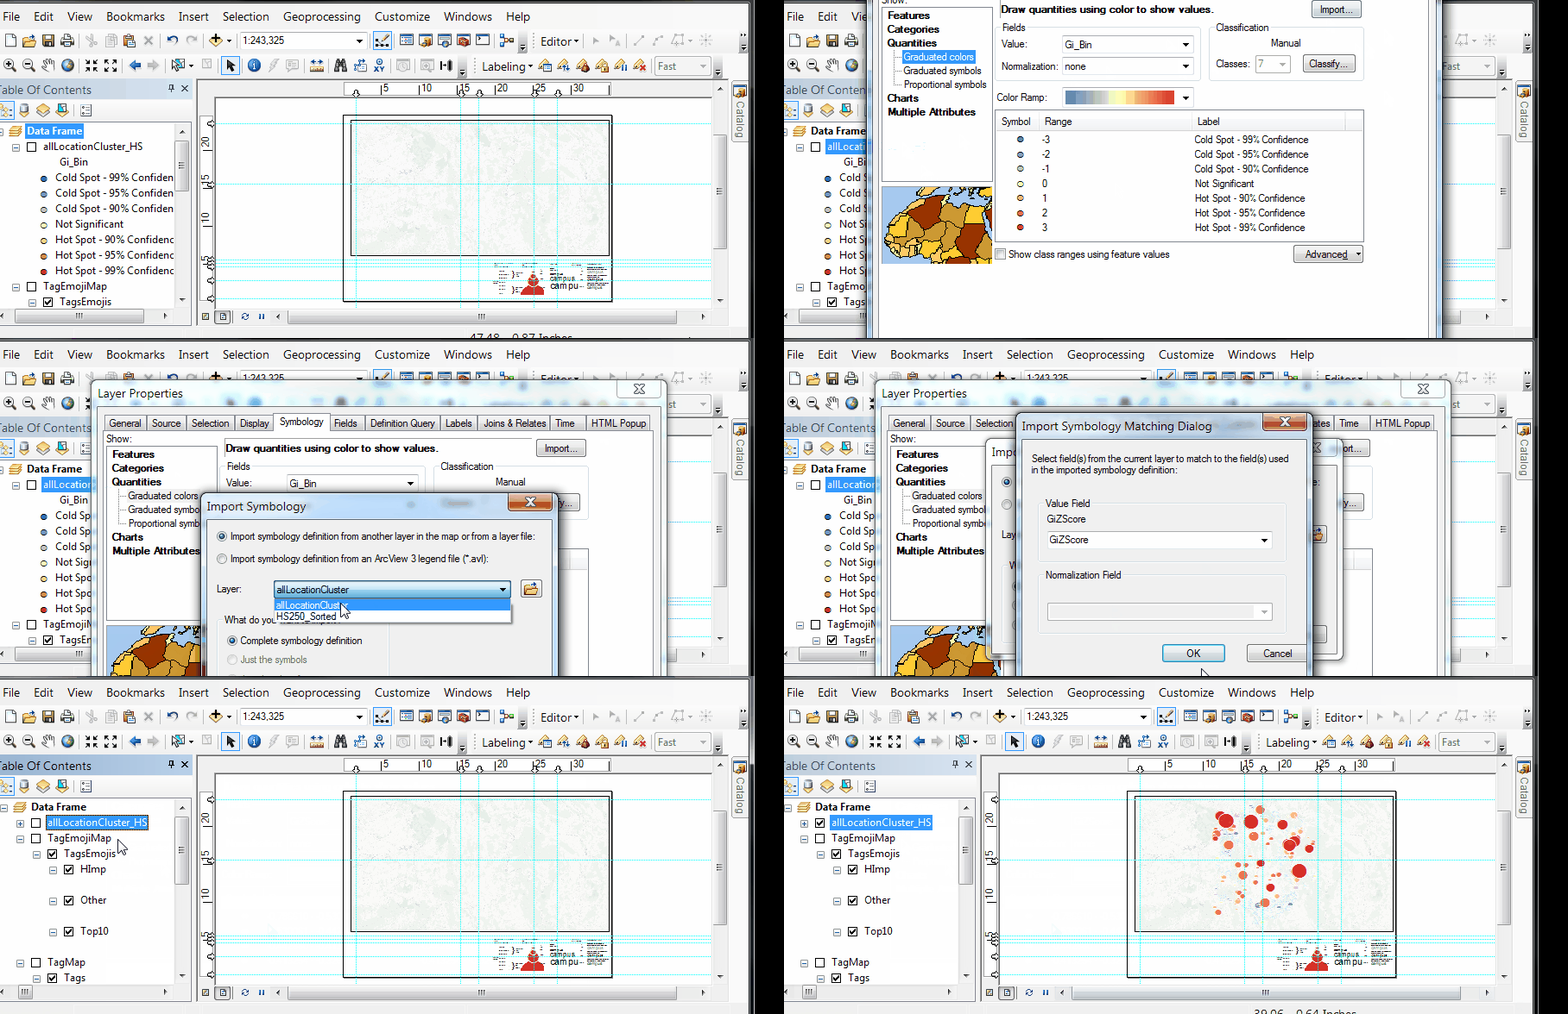
Load Symbology (double-click layer, Symbology: import from Layer HS250_Sorted)
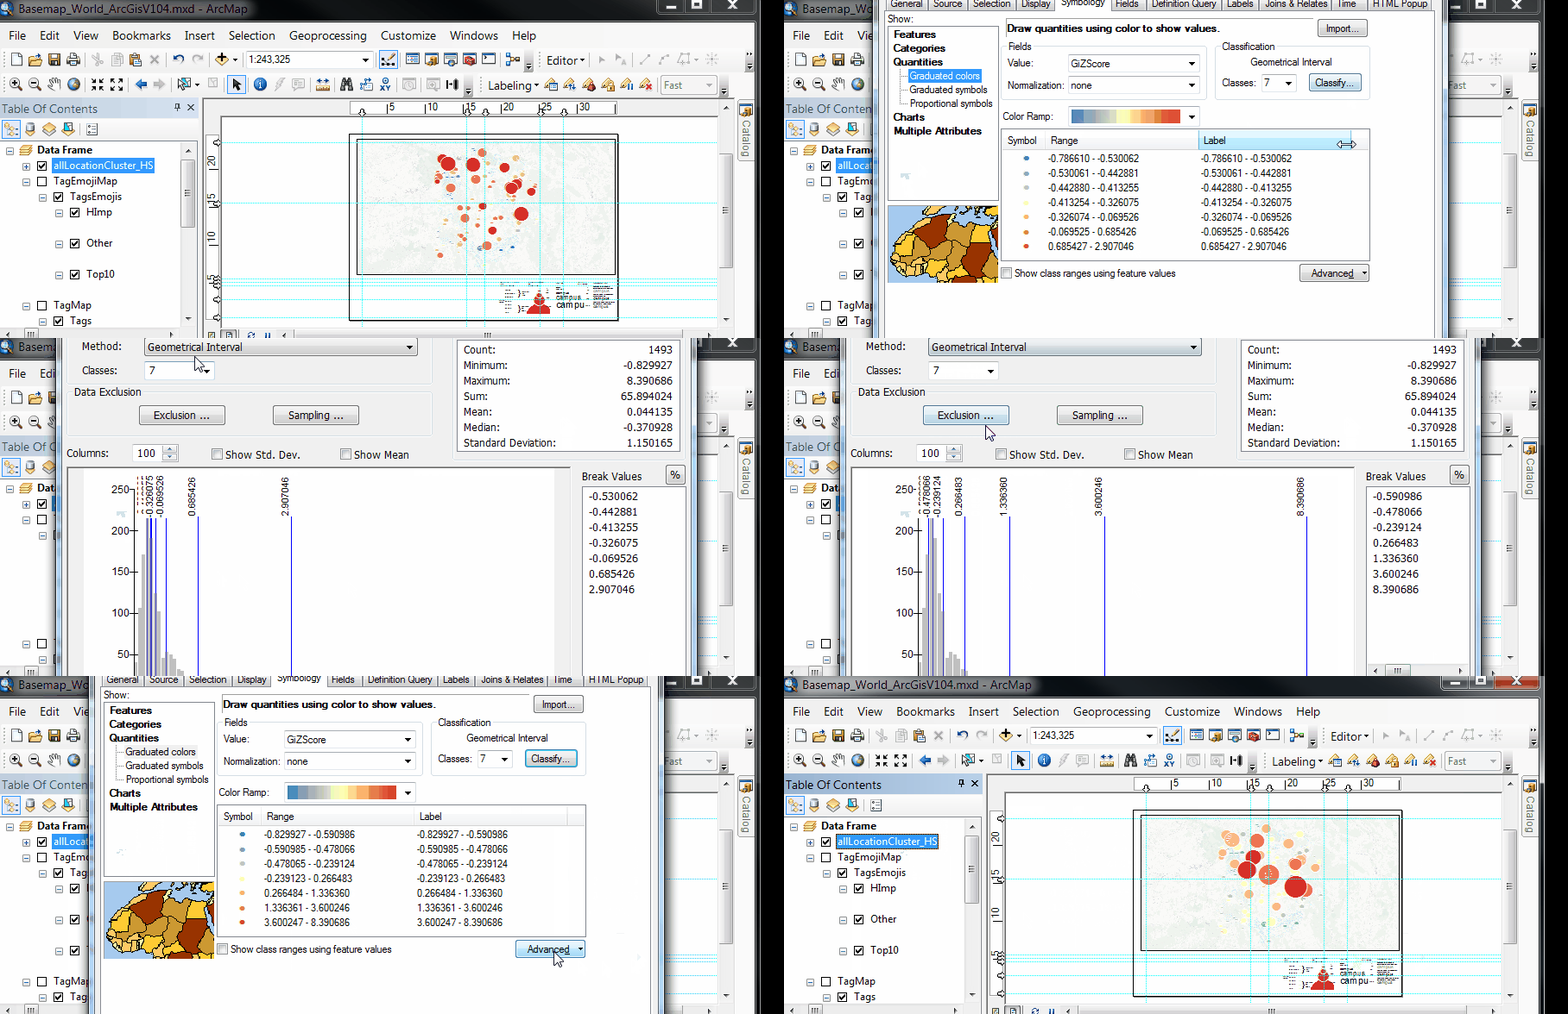
The existing classes of symbology layer must be updated/refreshed once.
(e.g.: switch once to Natural Breaks and back to Geometric Interval)
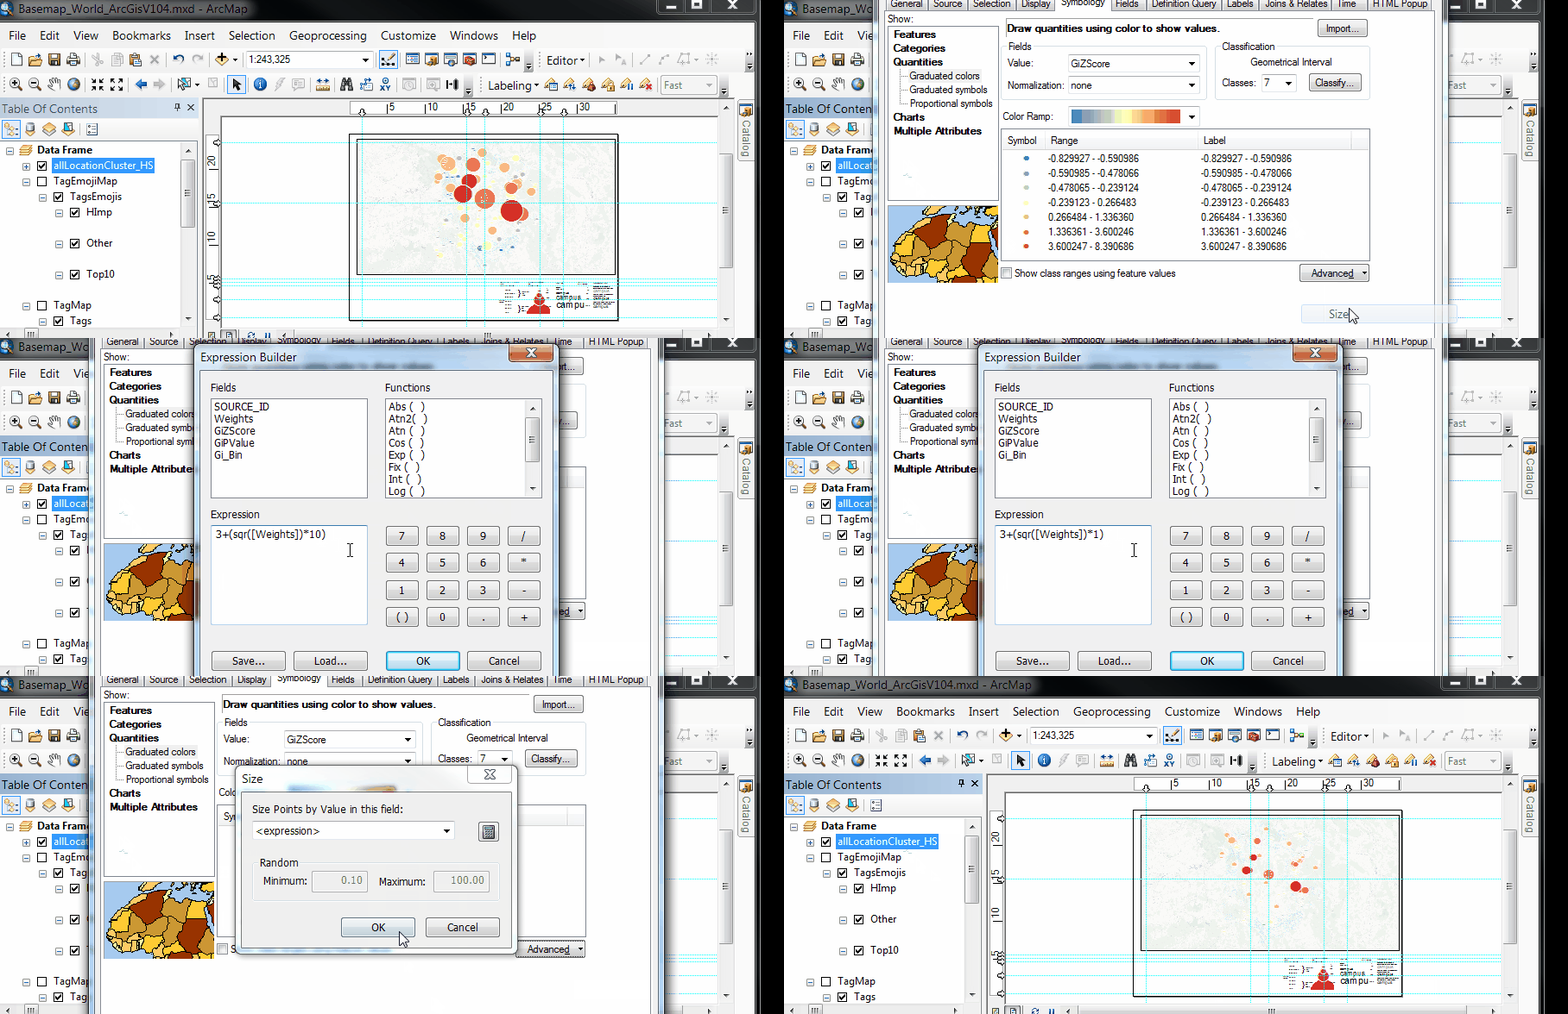
Finally, we can adjust the formula for max symbol size to fit the map extent.
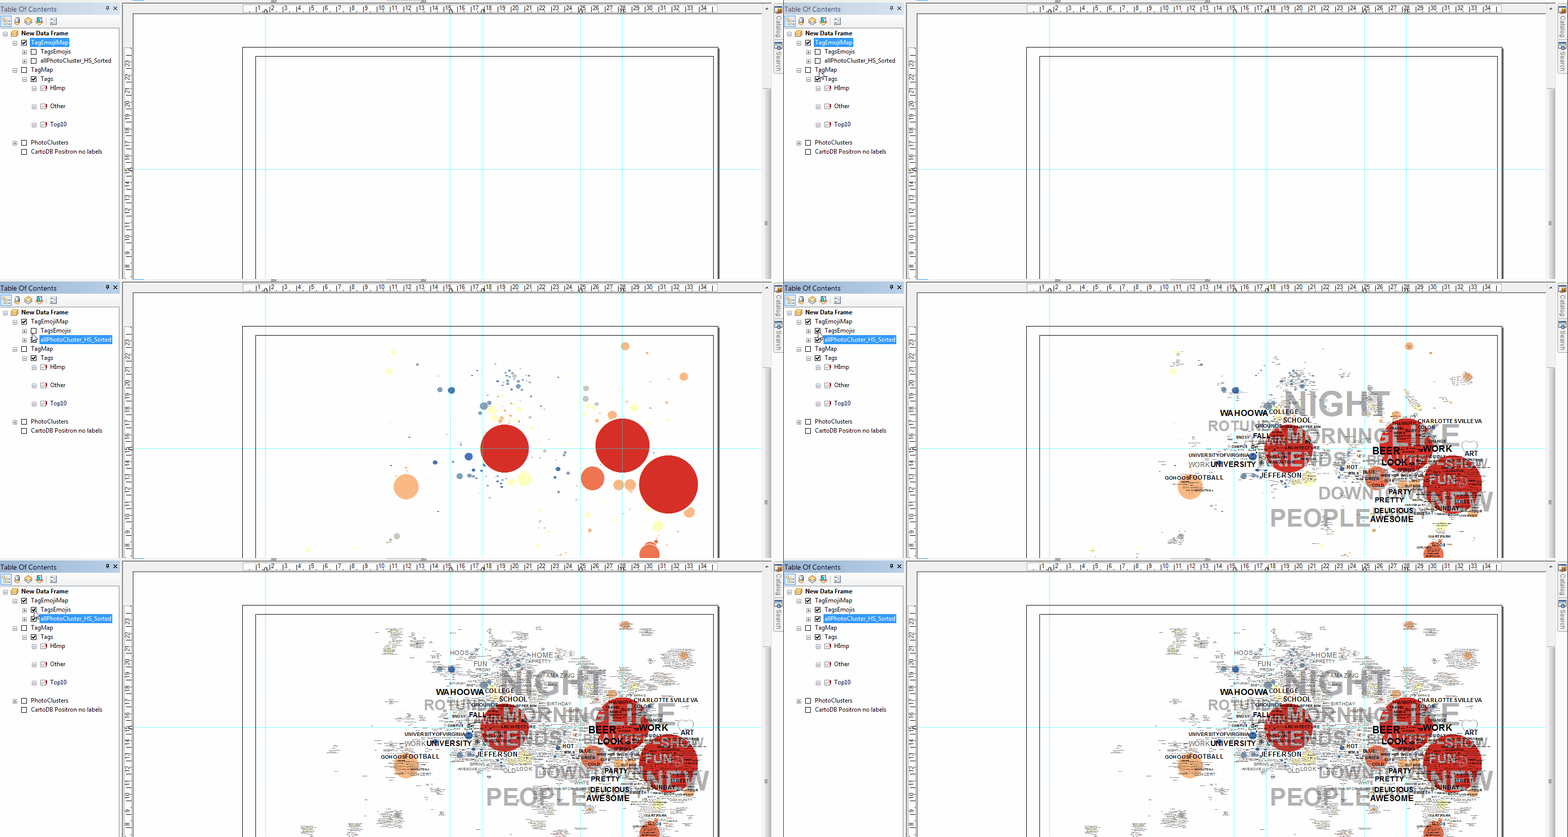 Sort layers and enable Location & Tag Clusters for viewing final result.
Export map
Export map to pdf or png.
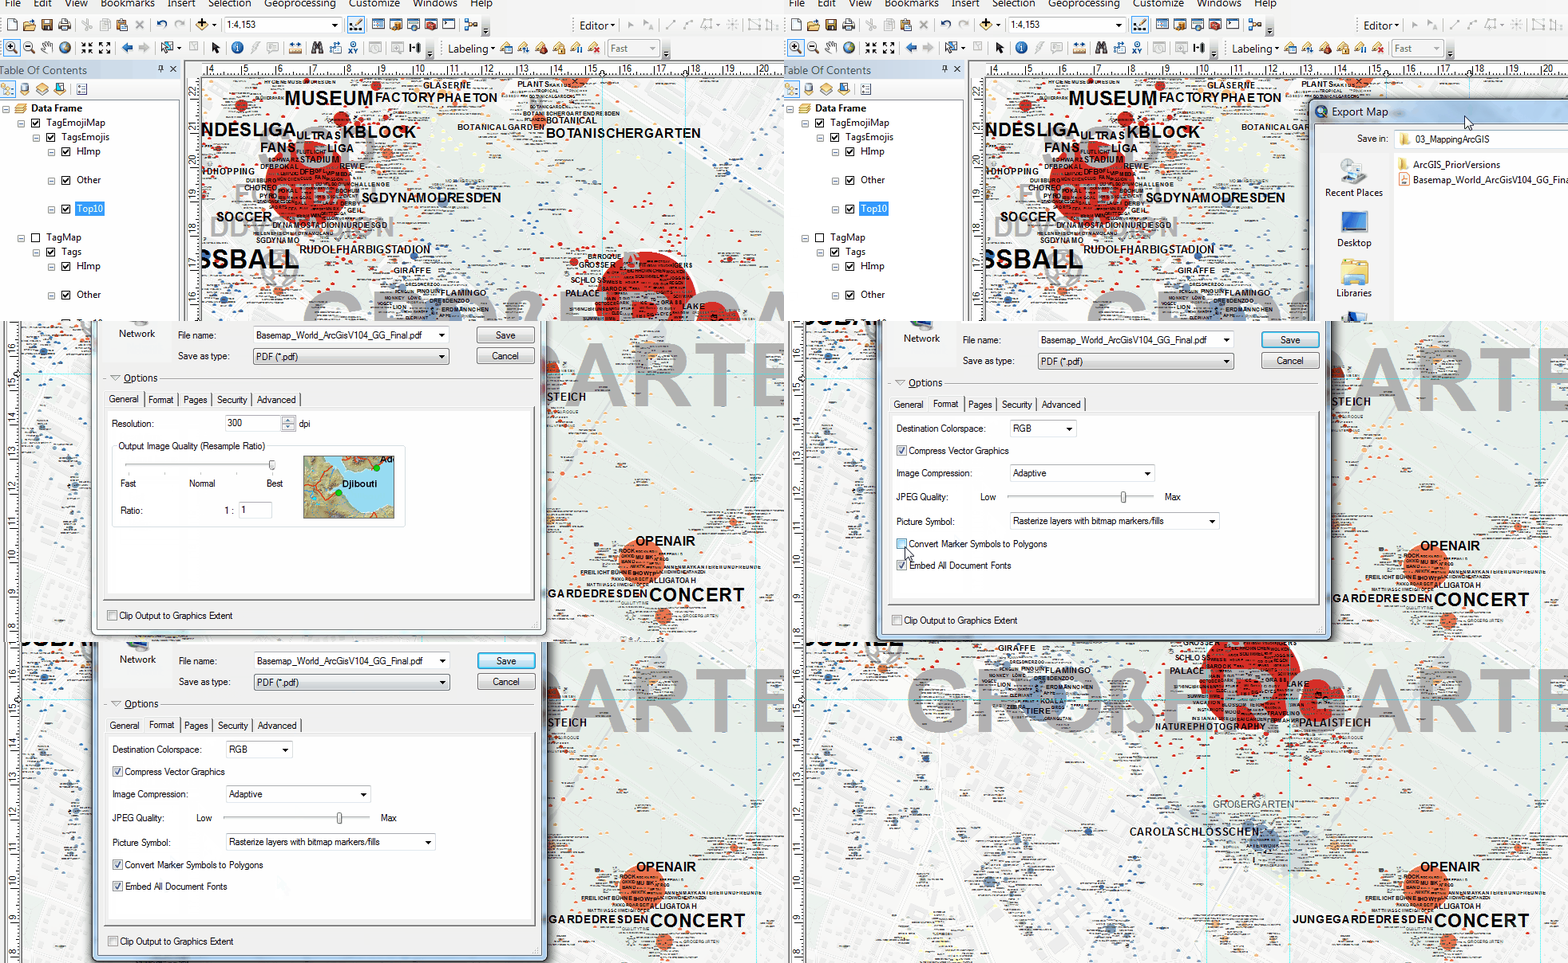
If exporting to PDF, make sure to check "Convert Marker Symbols to Polygons"
Note
There's a bug in ArcMap PDF Export that will result in Arcreader to render broken circle symbols. Selecting Conversion to polygon solves this issue.
Final map

Our final map with Tag, Emoji & Photo Location Clustering. Yay!
FAQ
A collection of frequently asked Tag Maps questions and issues.
Issue: Tag Map looks noisy, there're too many tags placed on the map.
- often caused by too large area selection because there's a limit to the number of labels that can be placed on the map
- either choose less variety of tags (e.g. 100 instead of 1000) or select smaller area
Issue: Tag Map shows one main hot spot surrounded by empty areas.
- this is a limitation of this type of visualization
- in areas, where a single hot spot dominates, the Tag Map will simply illustrate this unequal distribution
- either zoom in to hotspot and recluster at larger scale or choose an area with more equal distribution of frequentation patterns
Issue: Zooming in ArcGis does not provide higher information resolution.
- the final maps are static and must be reclustered for each scale
- this means that it is not possible to zoom in (e.g. in ArcGIS)
- therefore:
- work in layout mode with locked extent, do not use data mode in ArcGIS
- to zoom in, reselect data (e.g. ClipGeo) and recluster for new extent
