Concept
Papers
This section contains excerpts from the papers:
Dunkel, A. (2015). Visualizing the perceived environment using crowdsourced photo geodata. Landscape and Urban Planning, 142. DOI / PDF
Dunkel, A. (2016). Assessing the perceived environment through crowdsourced spatial photo content for application to the fields of landscape and urban planning. Thesis, TU Dresden Landscape and Environmental Planning. DOI / PDF
Dunkel, A., Andrienko, G., Andrienko, N., Burghardt, D., Hauthal, E., & Purves, R. (2019). A conceptual framework for studying collective reactions to events in location-based social media. International Journal of Geographical Information Science, 33, 4, 780-804. DOI / PDF
Note
The theoretic background presented here is part of a workshop & lecture series and is also available as Jekyll reveal slides.
Tag Maps Focus
- Exploratory Visualizations of Big Data for evaluating collective perception
- Enriching and supplementing traditional GI with implicitly collected Social Media
- Subjective, Human-scale values & attribution of meaning
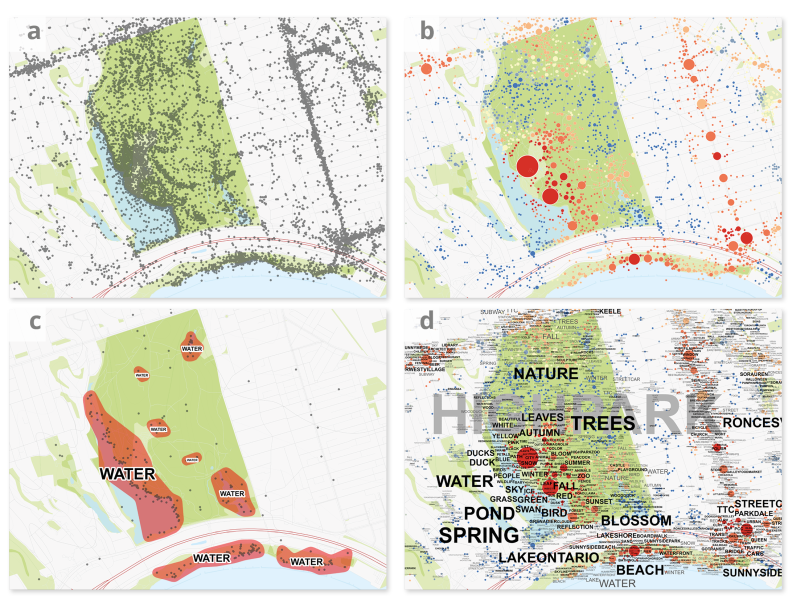
Overview of processing steps
Toronto High Park example:
- a) individual photo locations (raw data)
- b) photo locations combined to clusters
- c) tag location clustering (HDBSCAN) and Alpha-Shape generation
- d) soft placement of all relevant tag clusters using alpha shapes
User behavior in the context of social media photo sharing
Photo taking and photo sharing in communities can be seen as a sequential process.
Two separate steps can be distinguished, the content-creation process (taking photos) and the contribution process (sharing photographs and adding information). Some researchers consider the viewing of photos as a separate, third step (termed ‘photo consumption’).
Even if these steps are carried out separately, they are interrelated in specific ways.
First, taking a photo of something requires an active decision. Kevin Lynch proposed “[. . .] the generalized mental picture of the exterior physical world that is held by an individual [. . .] is the productboth of immediate sensation and of the memory of past experience, and it is used to interpret information and to guide action” (Lynch, 1960, p. 4). In summary of the findings from John Collier (1967), Susan Sontag (1977), and others (Dakin, 2003; Scott & Canter, 1997), the action of taking a photo can be considered as not only being triggered by the immediate environment, but by all aspects of cognition: personal preferences, memories, opinions, and more. Here, the need of beingin situ for creating spatial content (i.e. taking a photo) is crucial. As a result, the photograph that someone takes of a place, and the photographs they choose to upload may both reflect, in some way, their perceptions of the place.
Second, the subsequent, optional act of tagging photos is used by photographers to describe the important aspects of a picture for purposes of self-organization and communication. Tags do not only encompass physically visual elements but also conceptualized information of the environment. Tagging involves several mental processes. Contrary to direct perception, tags are assigned at a later time, based on the photo itself and the photographer’s memory of the scene. Even if tags relate to potentially visible elements, they may also describe associated aspects that are not visible in the photo. This means, there is no right or wrong in tagging photos; even uncommon words or unique descriptors may, from the user’s perspective, relate to (personally) relevant aspects of the photo and the memorized scene. Specifically because of this undirected nature, tags can function as artifacts of the user’s personal conceptualization and abstraction of the world.
Note
There's a lot of literature available on social media photo sharing and tagging behaviour. Some personal recommendations:
-
Steels, L. (2006). Collaborative tagging as distributed cognition. In: Harnad, S. & Dror, I. E., Cognition distributed: How cognitive technology extends our minds, Pragmatics & Cognition, 93-98.
-
Stvilia, B., & Jörgensen, C. (2010). Member activities and quality of tags in a collection of historical photographs in Flickr. Journal of the American Society for Information Science and Technology, 61, 12, 2477-2489.
-
Thurlow, C., & Jaworski, A. (2011). Banal globalization? Embodied actions and mediated practices in tourists’ online photo-sharing. In: Digital Discourse: Language in the New Media, Oxford University Press.
-
Scott, M. J., & Canter, D. V. (1997). Picture or Place? A Multiple Sorting Study Of Landscape. Journal of Environmental Psychology, 17, 4, 263-281
-
Garduno, F. C. (2010). Photosharing on Flickr: intangible heritage and emergent publics. [Additonal Summary] International Journal of Heritage Studies, 16, 4-5.
-
Golder, S., & Huberman, B. (2006). Usage patterns of collaborative tagging systems. Journal of Information Science, 32, 2, 198-208.
-
Dakin, S. (2003). There's more to landscape than meets the eye: towards inclusive landscape assessment in resource and environmental management. The Canadian Geographer, 47, 2, 185-200.
The conclusions relevant to the visualization algorithm of tagmaps are the following. If multiple people take photographs at a location, the photographs might be linked to a specific visible or associated characteristic (or absence of characteristics) that initiates the same decision process for that place or area. The more people that follow these patterns, the more significant the underlying characteristics might be. The same applies to tags as semantic descriptors of the abstracted, memorized scene. Repeatedly used tags in an area may relate to similar perceptual or cognitive processes triggered in groups or sub-groups of people by the environment. Thus, it can be said that graphics generated from crowdsourced photo content, such as tagmaps, visualize perception and cognition-based decision processes. An important characteristic follows: there is no known dimension that can be assigned directly to values. Therefore, it is of higher importance to visualize relative meaning rather than absolute numbers.
Data processing
Because perceptual patterns manifest differently on different scales, tagmaps are scale dependent. The aggregation of data on different scales results in different patterns emerging on the final map.
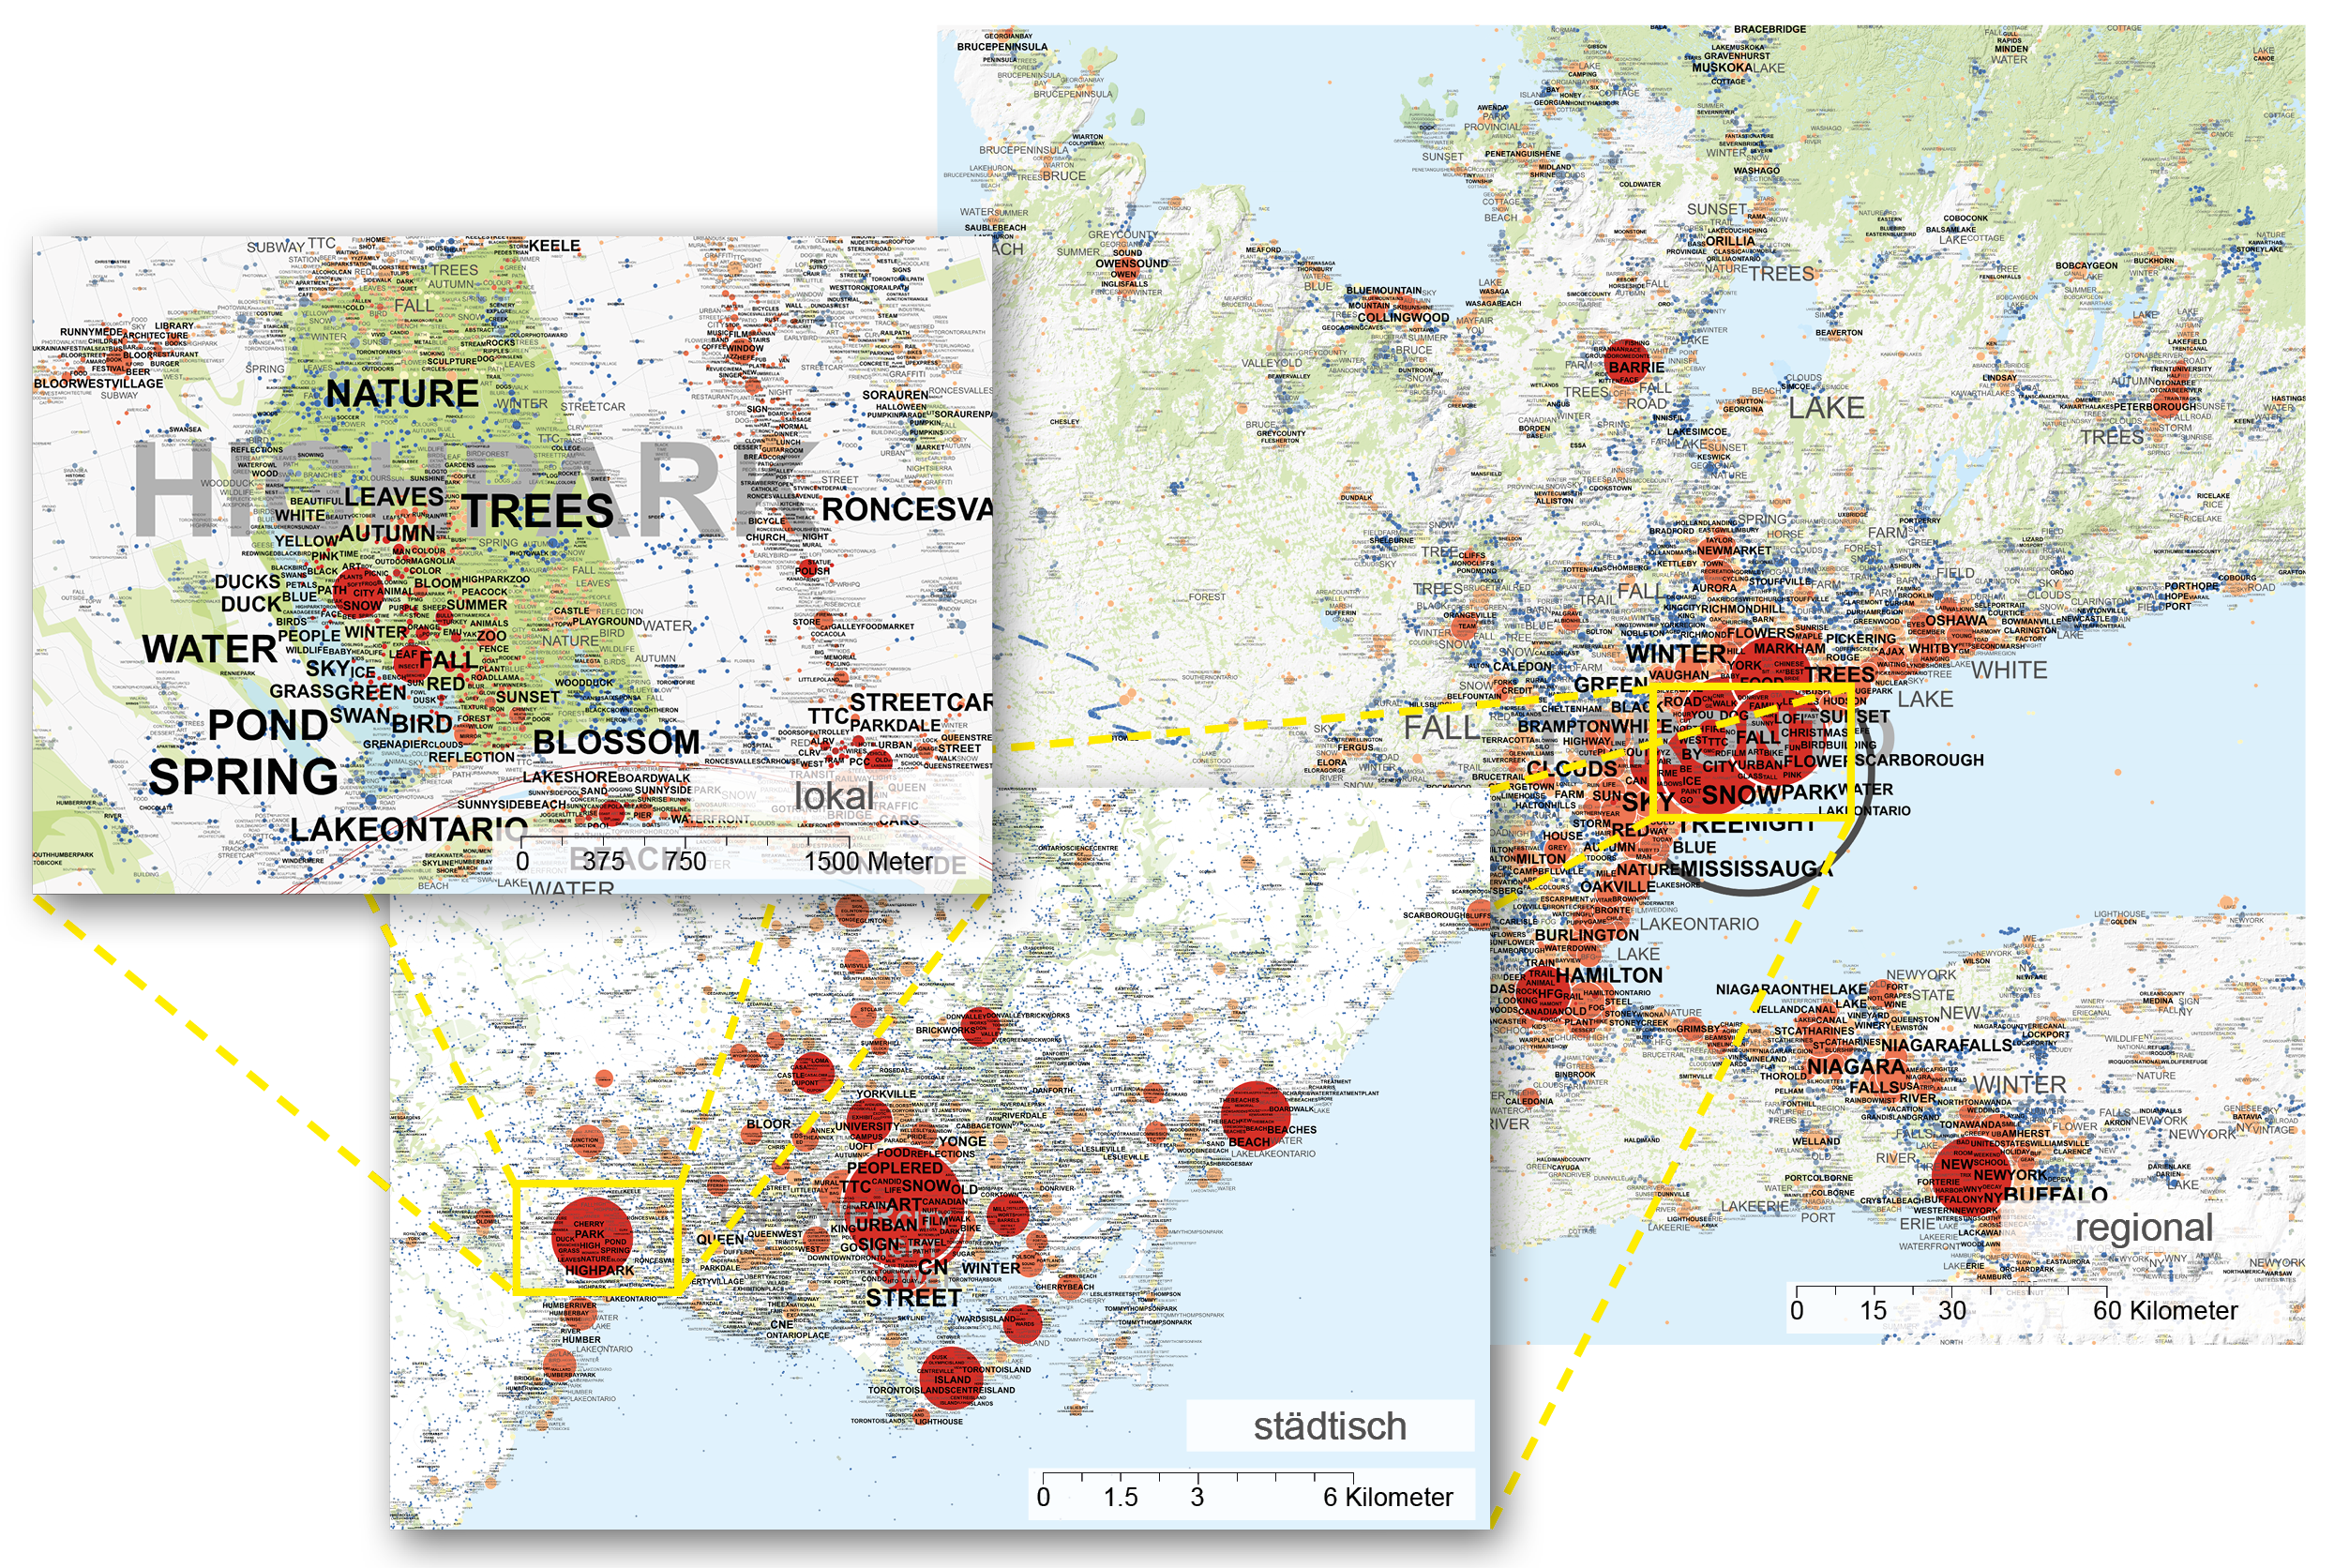
Tag Maps generated for different scales: 1) Greater Toronto Area (GTA), 2) Toronto City, 3) High Park
The following steps demonstrate data processing for the example area for High Park (Toronto).
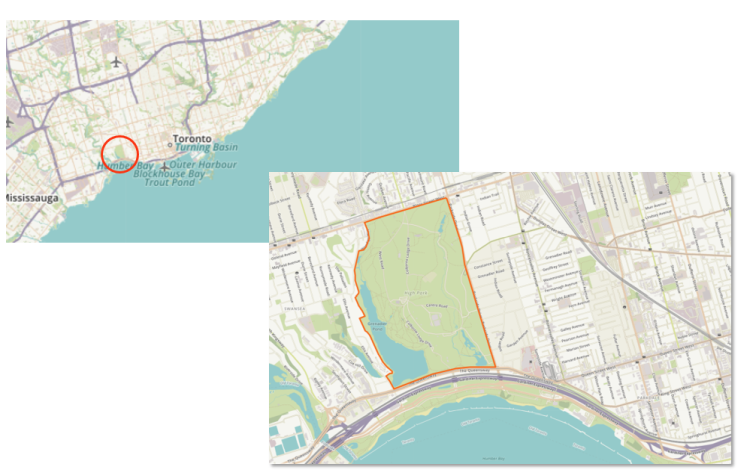
Location of High Park in Toronto
Raw data
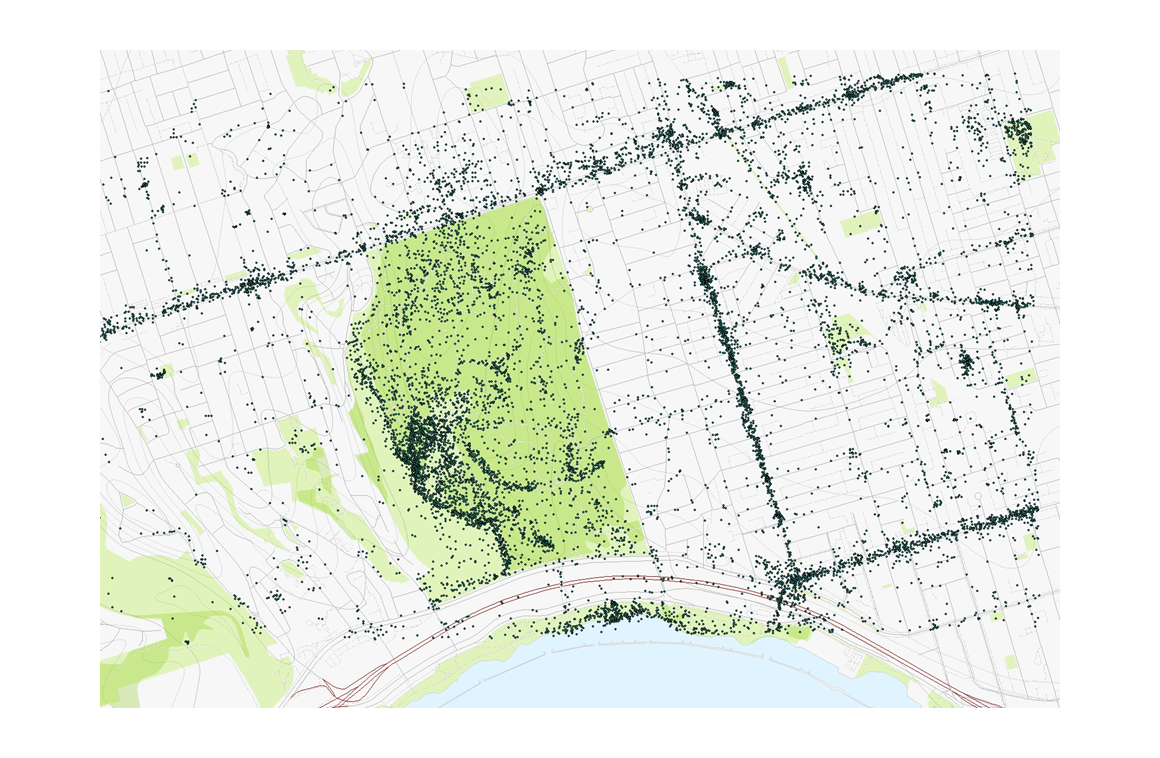
Photo locations in High Park: each dot represents a single photo
- 31,000 Photo Locations and 207,009 Tags
- 9000 distinct locations and 16,000 distinct tags
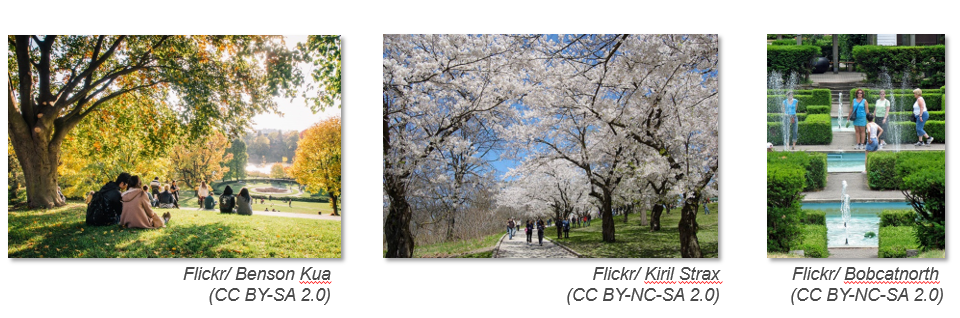 Example Photos: High Park
We can look at some of the photos to get some general idea of what is going on in High Park. However, looking at individual photos won't give us an accurate overview of all aspects that are perceived, and to which degree.
First layer: Photo location clustering
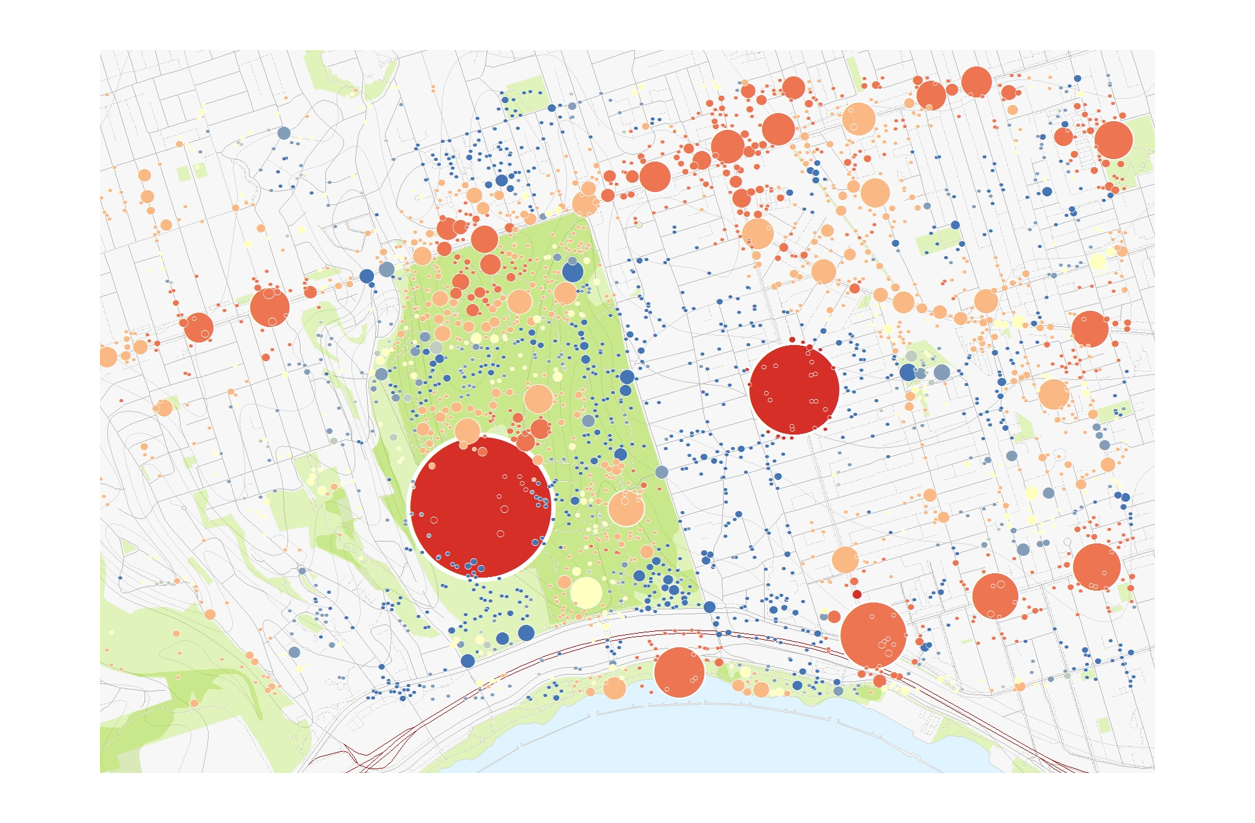
High Park Tag Map, first Layer: Photo Location Clustering
Circles are scaled based on a formula that takes into account number of users and number of photos. The result can be used to study overall photo attribution and general frequentation patterns, e.g. which areas were collectively considered memorable to be photographed.
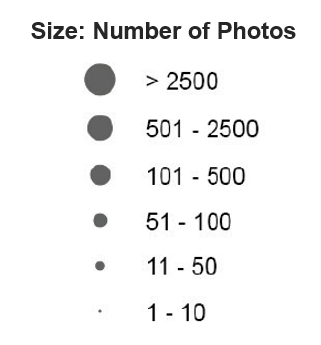
Photo Location Clustering Legend
Animation of different cluster distances affecting the granularity of clustering
Since HDBSCAN is a single linkage bottom-up clustering method, data (photo locations) group itself along similar patterns of density, beginning with the highest density areas.
Additionally, the Getis Ord Star Statistic is used to colorize clusters based on similar distribution patterns for areas. The results are displayedwith dots of different size and in different color variations: red forhot spots where significantly more pictures were taken comparedto the overall area of investigation and blue for cold spots for areasthat do not get as much attention.
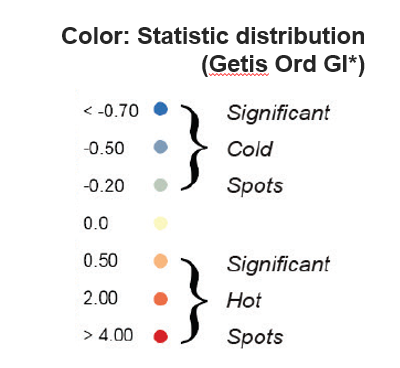
This allows combining information from different scales. E.g. reddish areas highlight dense spots where clusters will fall together first when increasing the cluster distance.
Photo Location Clustering: Cold and Hot Spots
Second layer: Tag Location Clustering
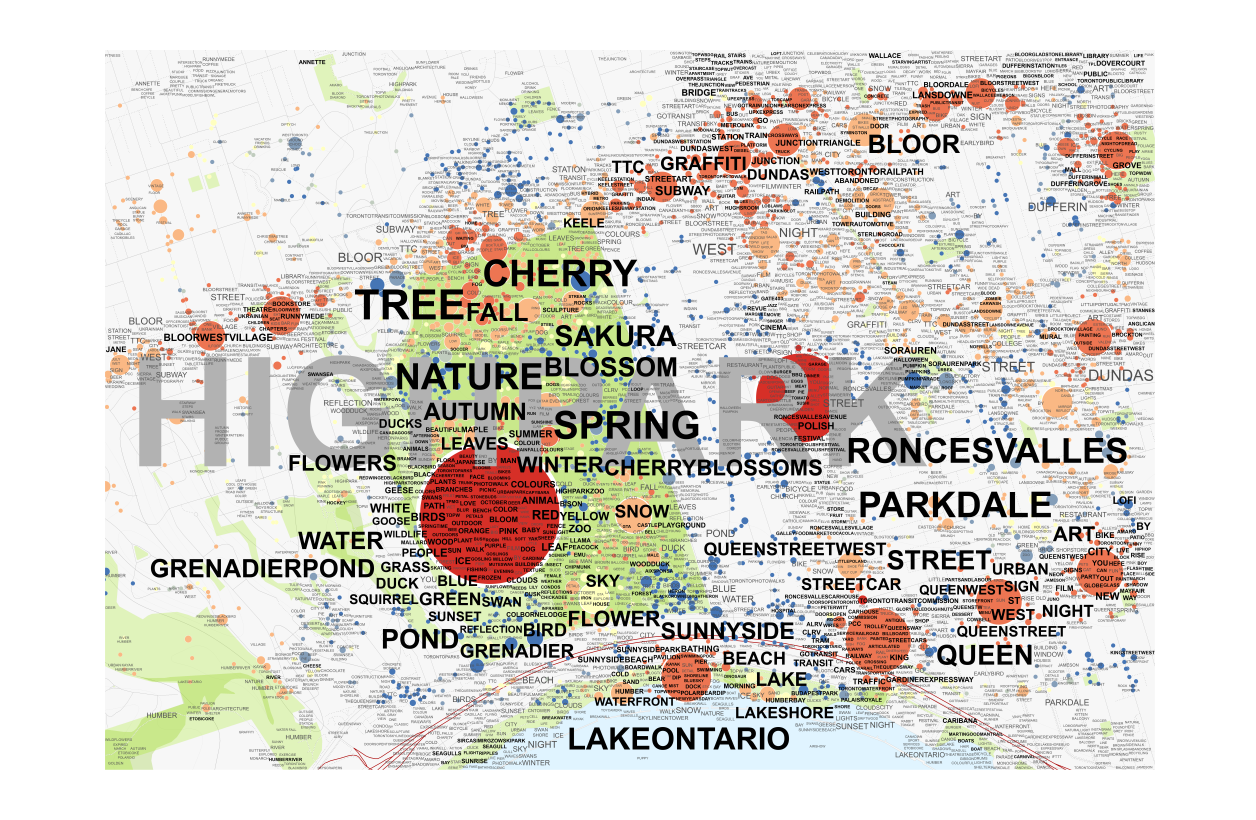
Final Tag Map, combining photo location cluster layer (1) and tag cluster layer (2)
In a similar fashion, tag location clustering is calculated and added as a separate second layer on top of the location clusters.
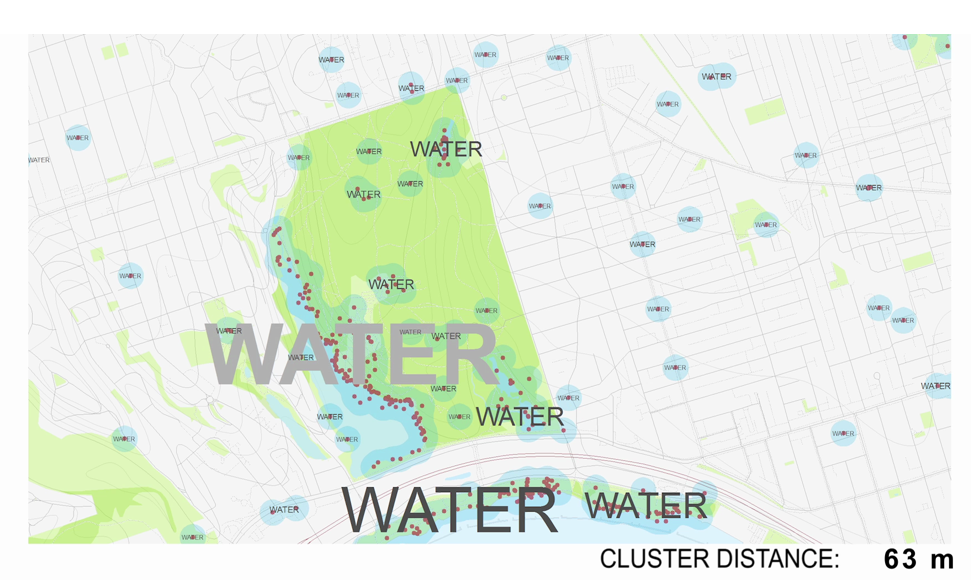
Lets have a look at a single tag first, e.g. perception of "water" in High Park.
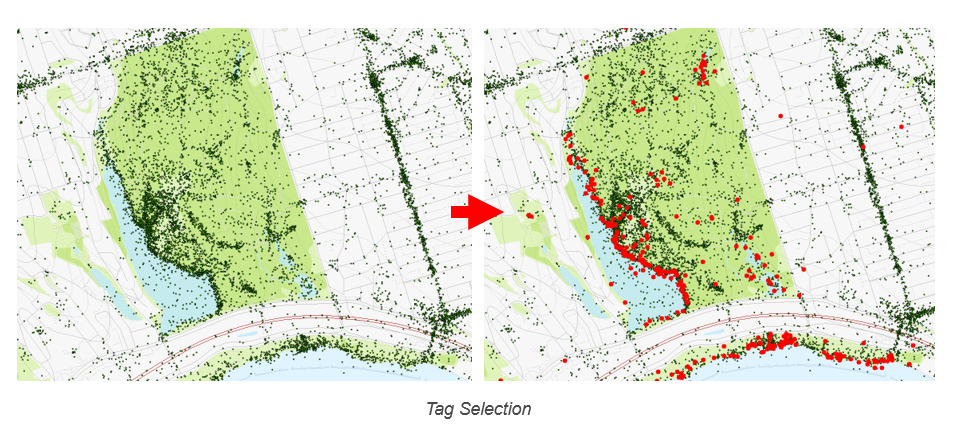
Location of Photos with Tag ‘WATER’
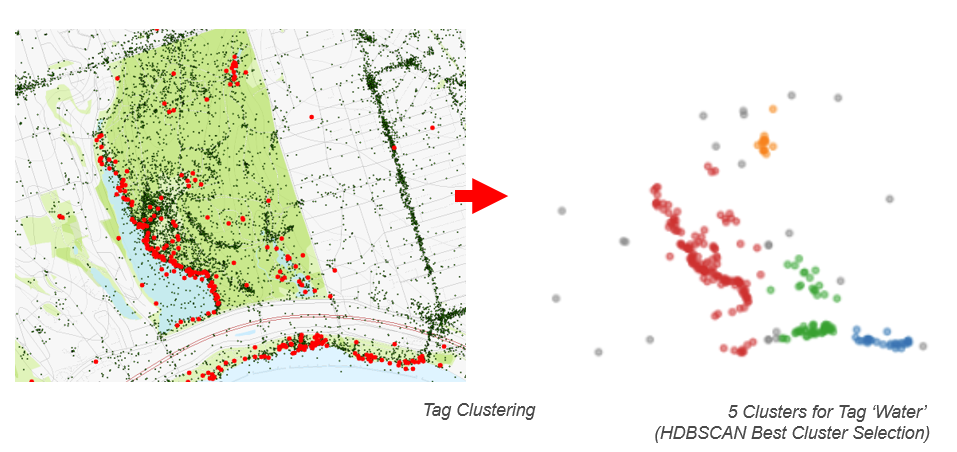
‘WATER’: Clustered
The clustering is implemented using the single-linkage tree that is available from HDBSCAN. The advantage over k-means and mean shift is that no input is required as to the number of clusters. Different tags may have many different number of clusters in an area, and choosing one value is not possible.
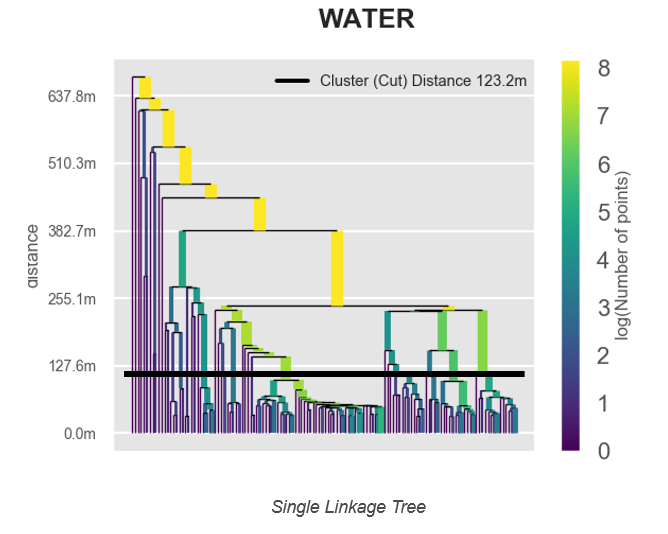
Cluster Stopping Criteria: Cut Distance
Therefore, all cluster trees (Dendrograms) for tags are cut at the same user-defined distance, to allow comparison of patterns at the given scale.
Choosing the best Cluster Distance
Compare the following graphics for the tag 'water' and different clustering distances:
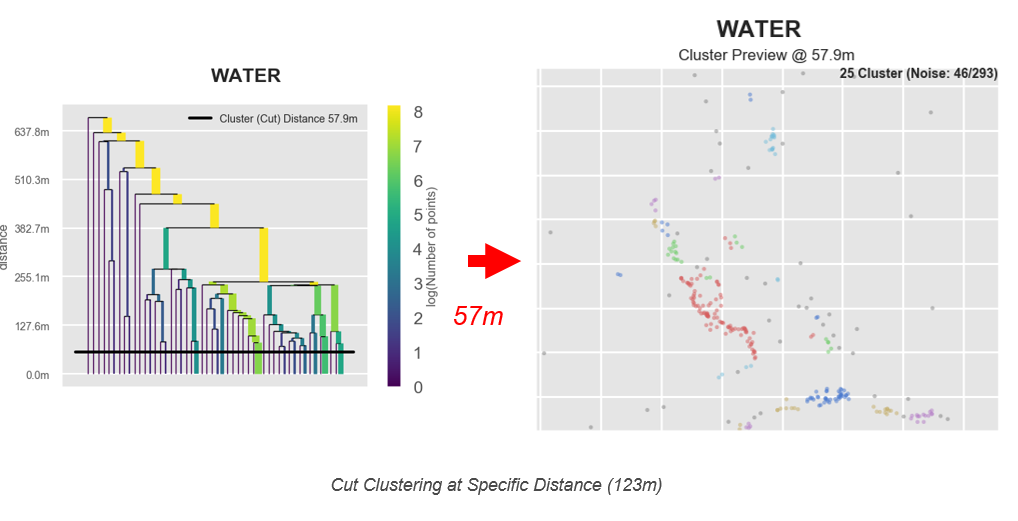
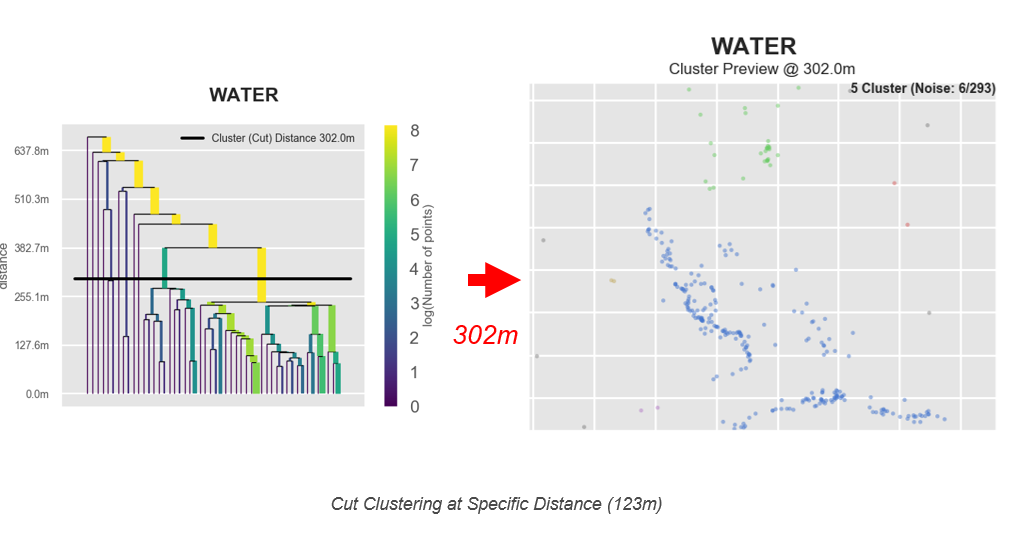
It is obvious that the cluster distance significantly affects results. Therefore, tagmaps allows to modify the cluster distance. The default cluster distance is calculated based on the extent of analysis. Depending on the context of analysis, either increasing or decreasing cluster distance can be used to modify granularity of the resulting tag cloud.
Note
Importantly, the same cluster distance is applied to all tags, as a means to ensure comparability of results.
Have a look at the following clusters detected for the same clustering distance but for different tags:
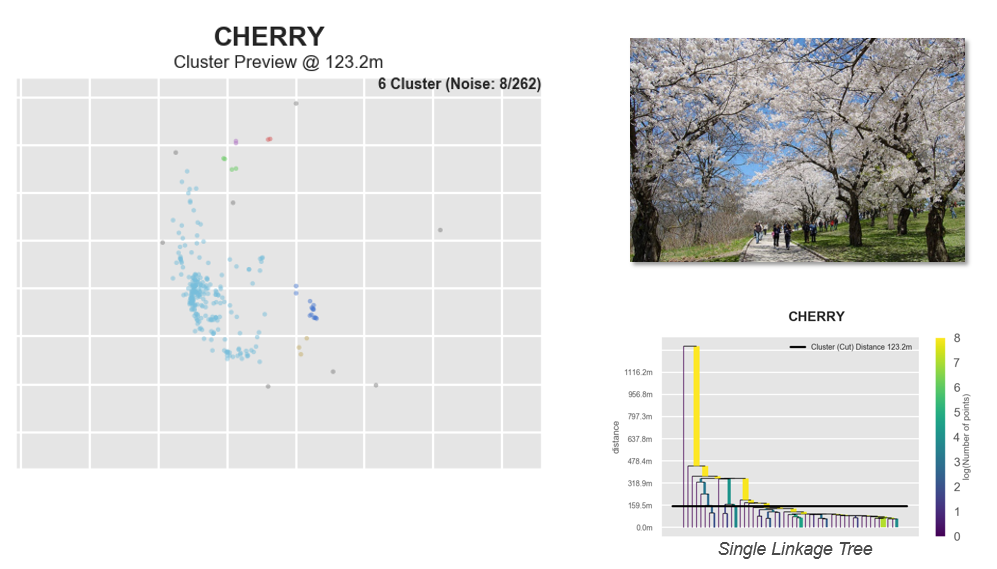
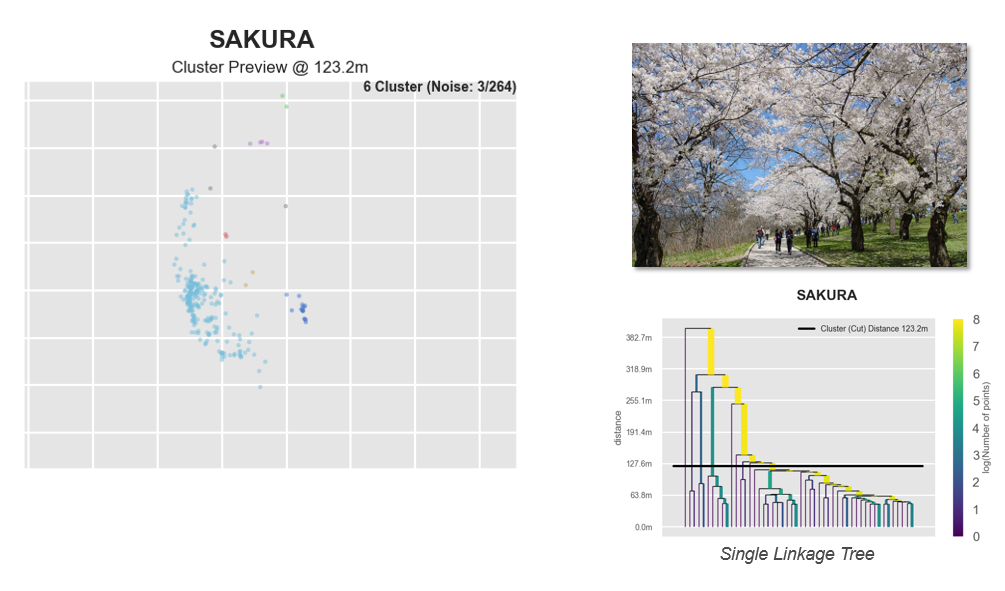
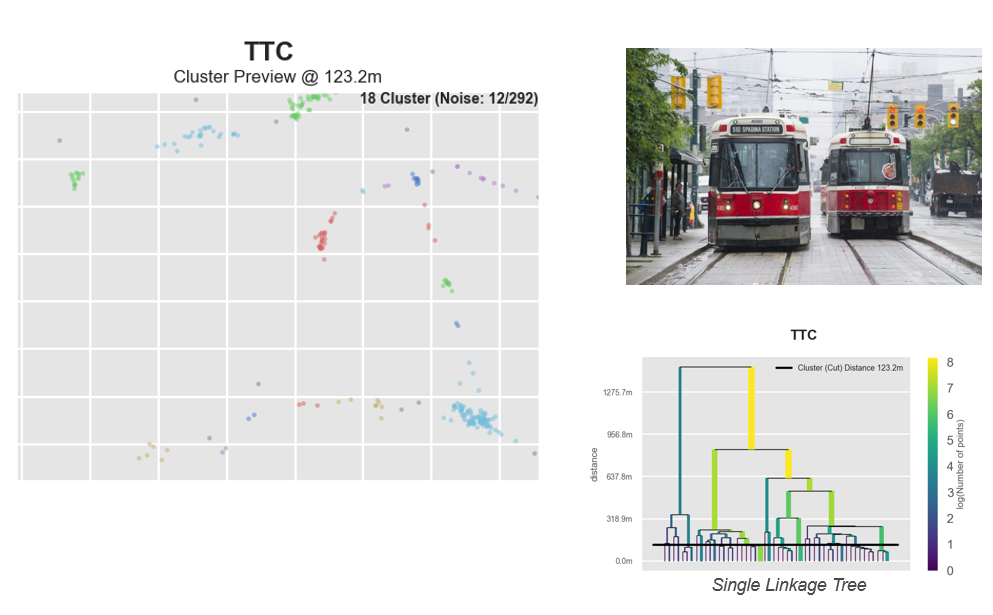
Some aspects feature more pronounced clustering (e.g. sakura or cherry) at the given scale than others. The clustering for (e.g.) ttc, which is an abbreviation for Toronto Transit Commission, may be more pronounced on the city scale, e.g.:
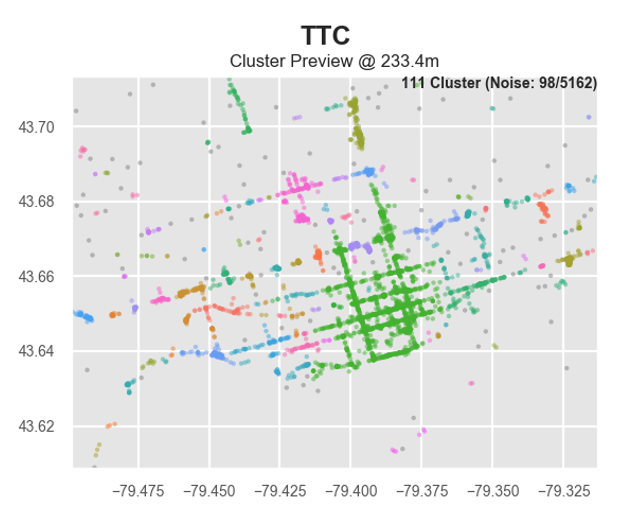
Tag Clustering at different scales
As a results, tag maps feature different patterns depending on the chosen scale and clustering distance.
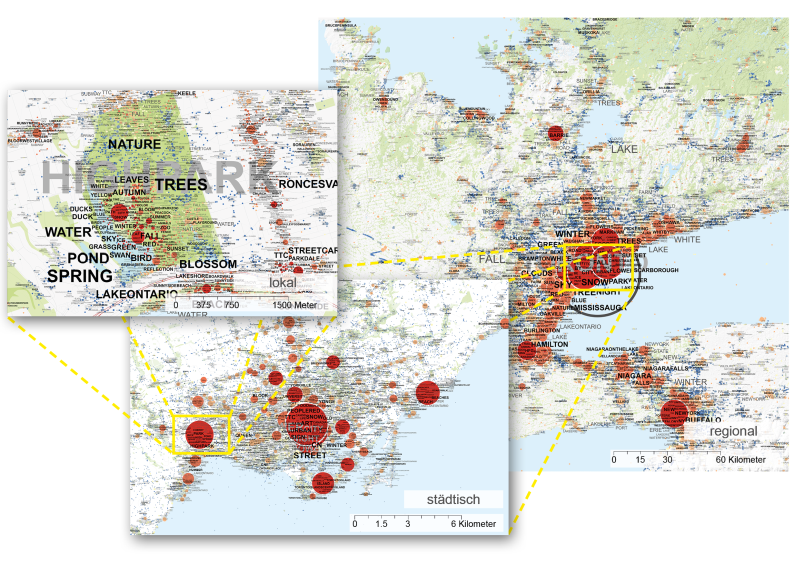
Tag Maps for different scales: High Park - Toronto - Greater Toronto Area
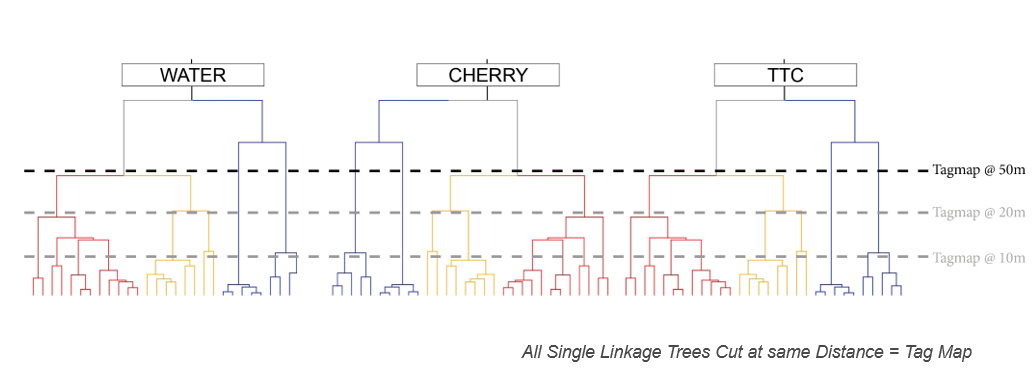
Illustration of Tag Maps generation at different scales with different cluster cut distances used