Visualization with Mapnik
As of tagmaps 0.21.0, visualization in Mapnik is supported, as an alternative
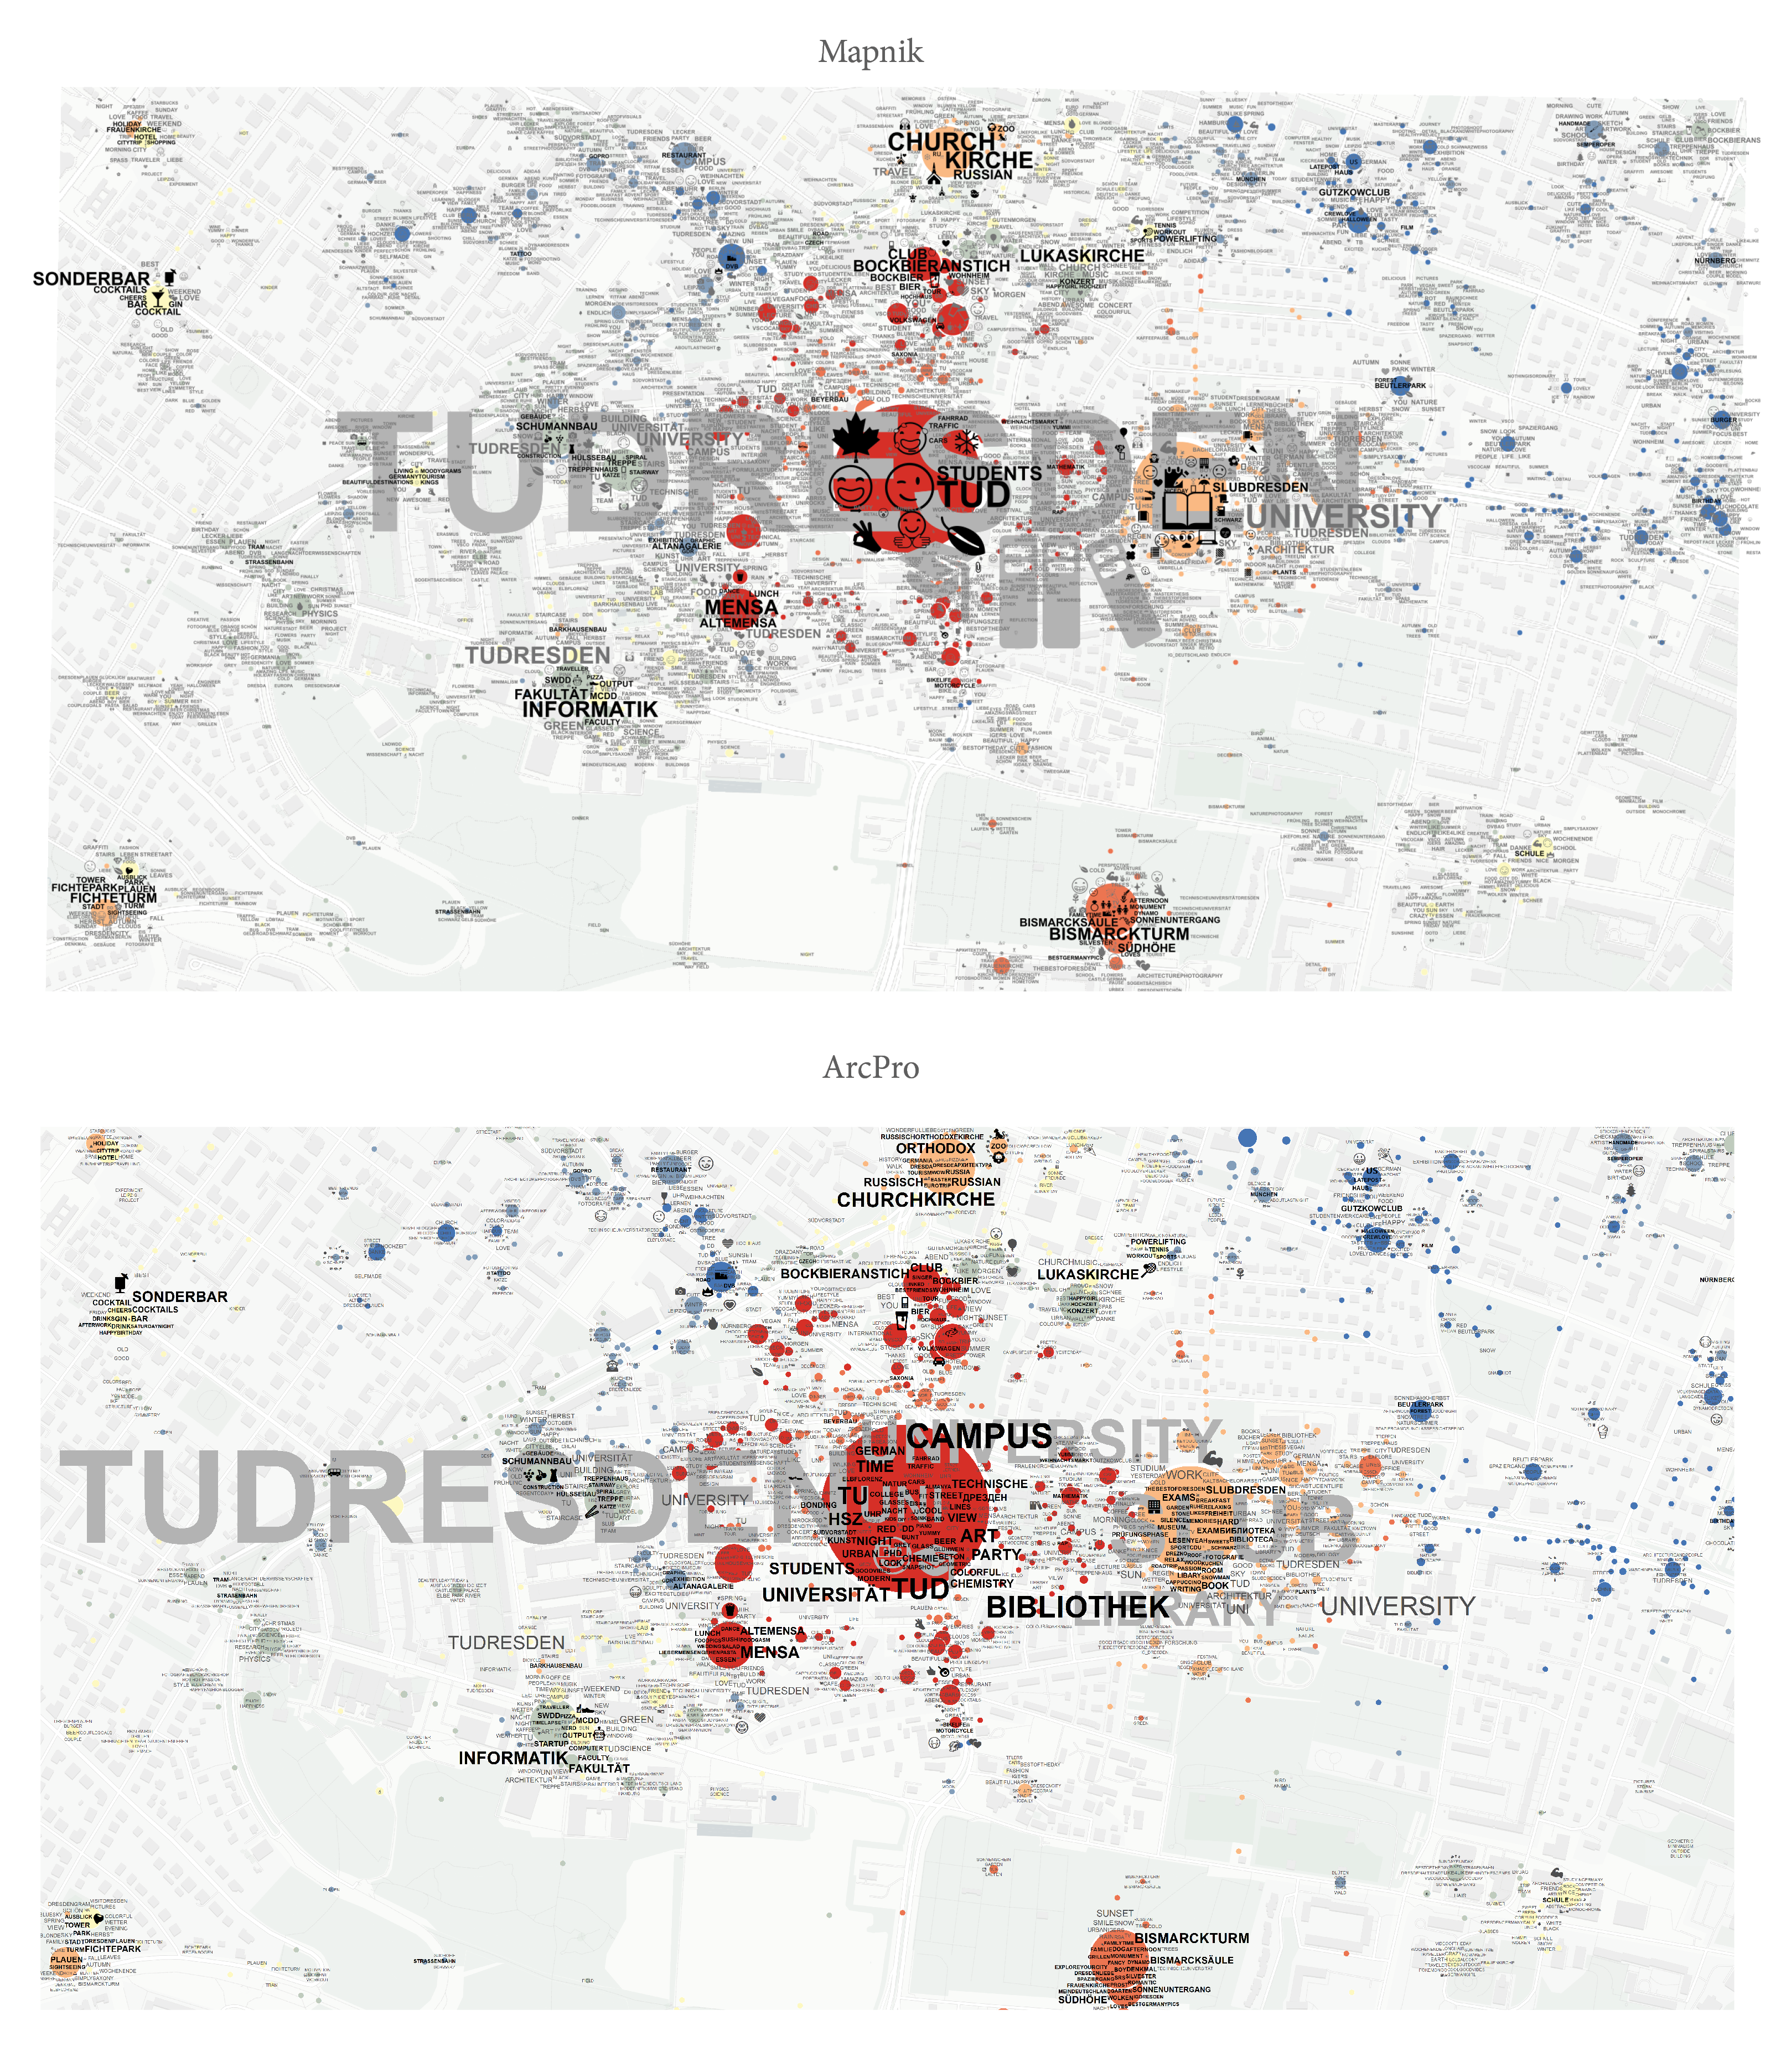
to the visualization in ESRI ArcGIS illustrated in the tutorial.
Due to the different label processes and style parameters, Mapnik maps allow more fine grained control over the label placement, such as limiting the allowed offset of labels in dense areas.
Mapnik is the render engine backing OpenStreetMap and offers extensive options to customize rendering of spatial data such as produced by tagmaps.
Enable this option with the flag --mapnik_export
tagmaps --mapnik_export
If this flag is enabled, instead of creating a separate emojiTable.csv,
to be joined in ArcGIS to the shapefile,
emoji will be stored directly in the generated output file (allTagCluster.shp)
and can be directly rendered with Mapnik.
Jupyter Notebook Tutorial
A jupyter notebook illustrates the process for rendering of these shapefiles in Mapnik.